Through the Streets of San Francisco
If there's one thing that I have learned from my stay in the Silicon Valley, is that Americans love their cars and trucks. Oh boy if they do. This results in having the majority of the transport infrastructure leaning HEAVILY towards car-based movements (to the point that cycling or walking to get to places feels a bit like a quirky habit?).
I could write a whole post about this, but for now let's just say that for somebody used to do most of their errands just cycling around and hopping on trains, that was a bit traumatic. I'll never forget entering SF for the first time by motorbike and realizing that there's a literal highway (the 101) passing through the center of the city, not around it (like I'm used to from Rome/London/Paris, which all have a big ring outside the historical city center).
So last year, using this trauma as a positive motivation (what you're gonna do otherwise?), I decided to start digging up open data about the occurrence of car crashes in SF. Given I lived a few years in London, I was curious also to draw some quick parallels. The report that follows is a collection of visualizations analyzing the last 20 years of car crashes in the city, thanks to the open data provided by https://data.sfgov.org.
I'll let you draw your own conclusions around trends, but I personally spotted a few things:
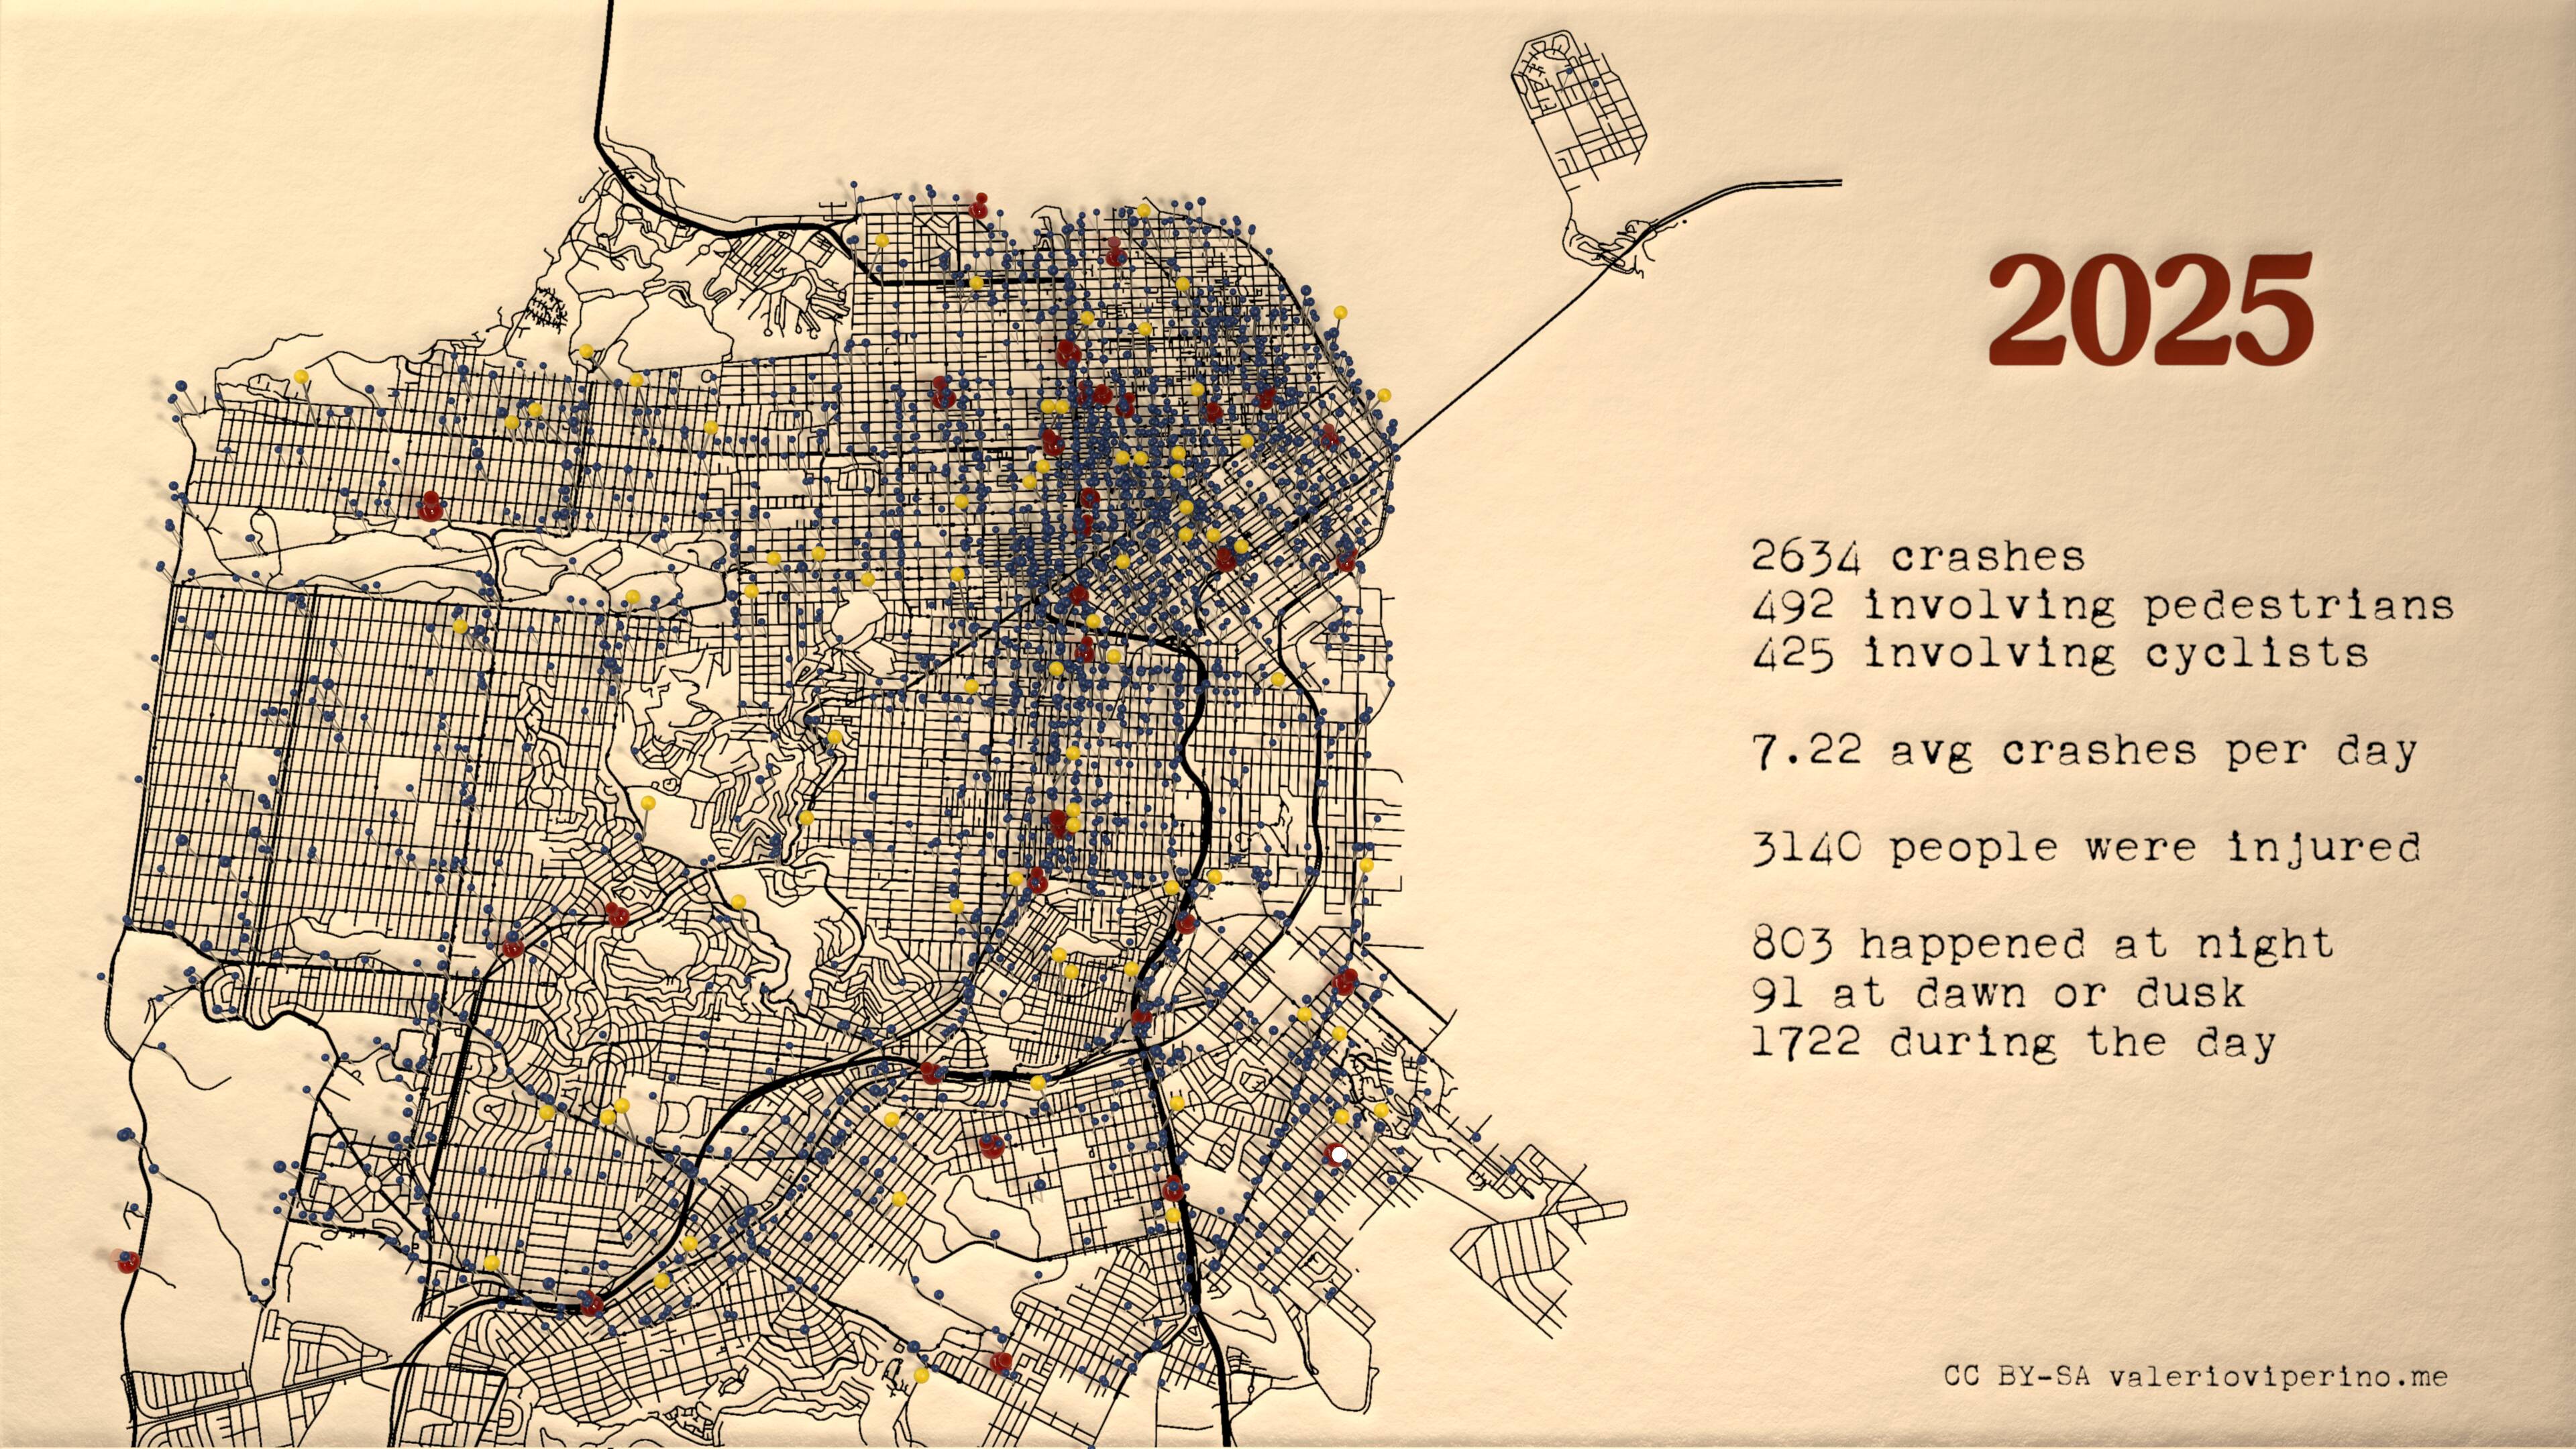
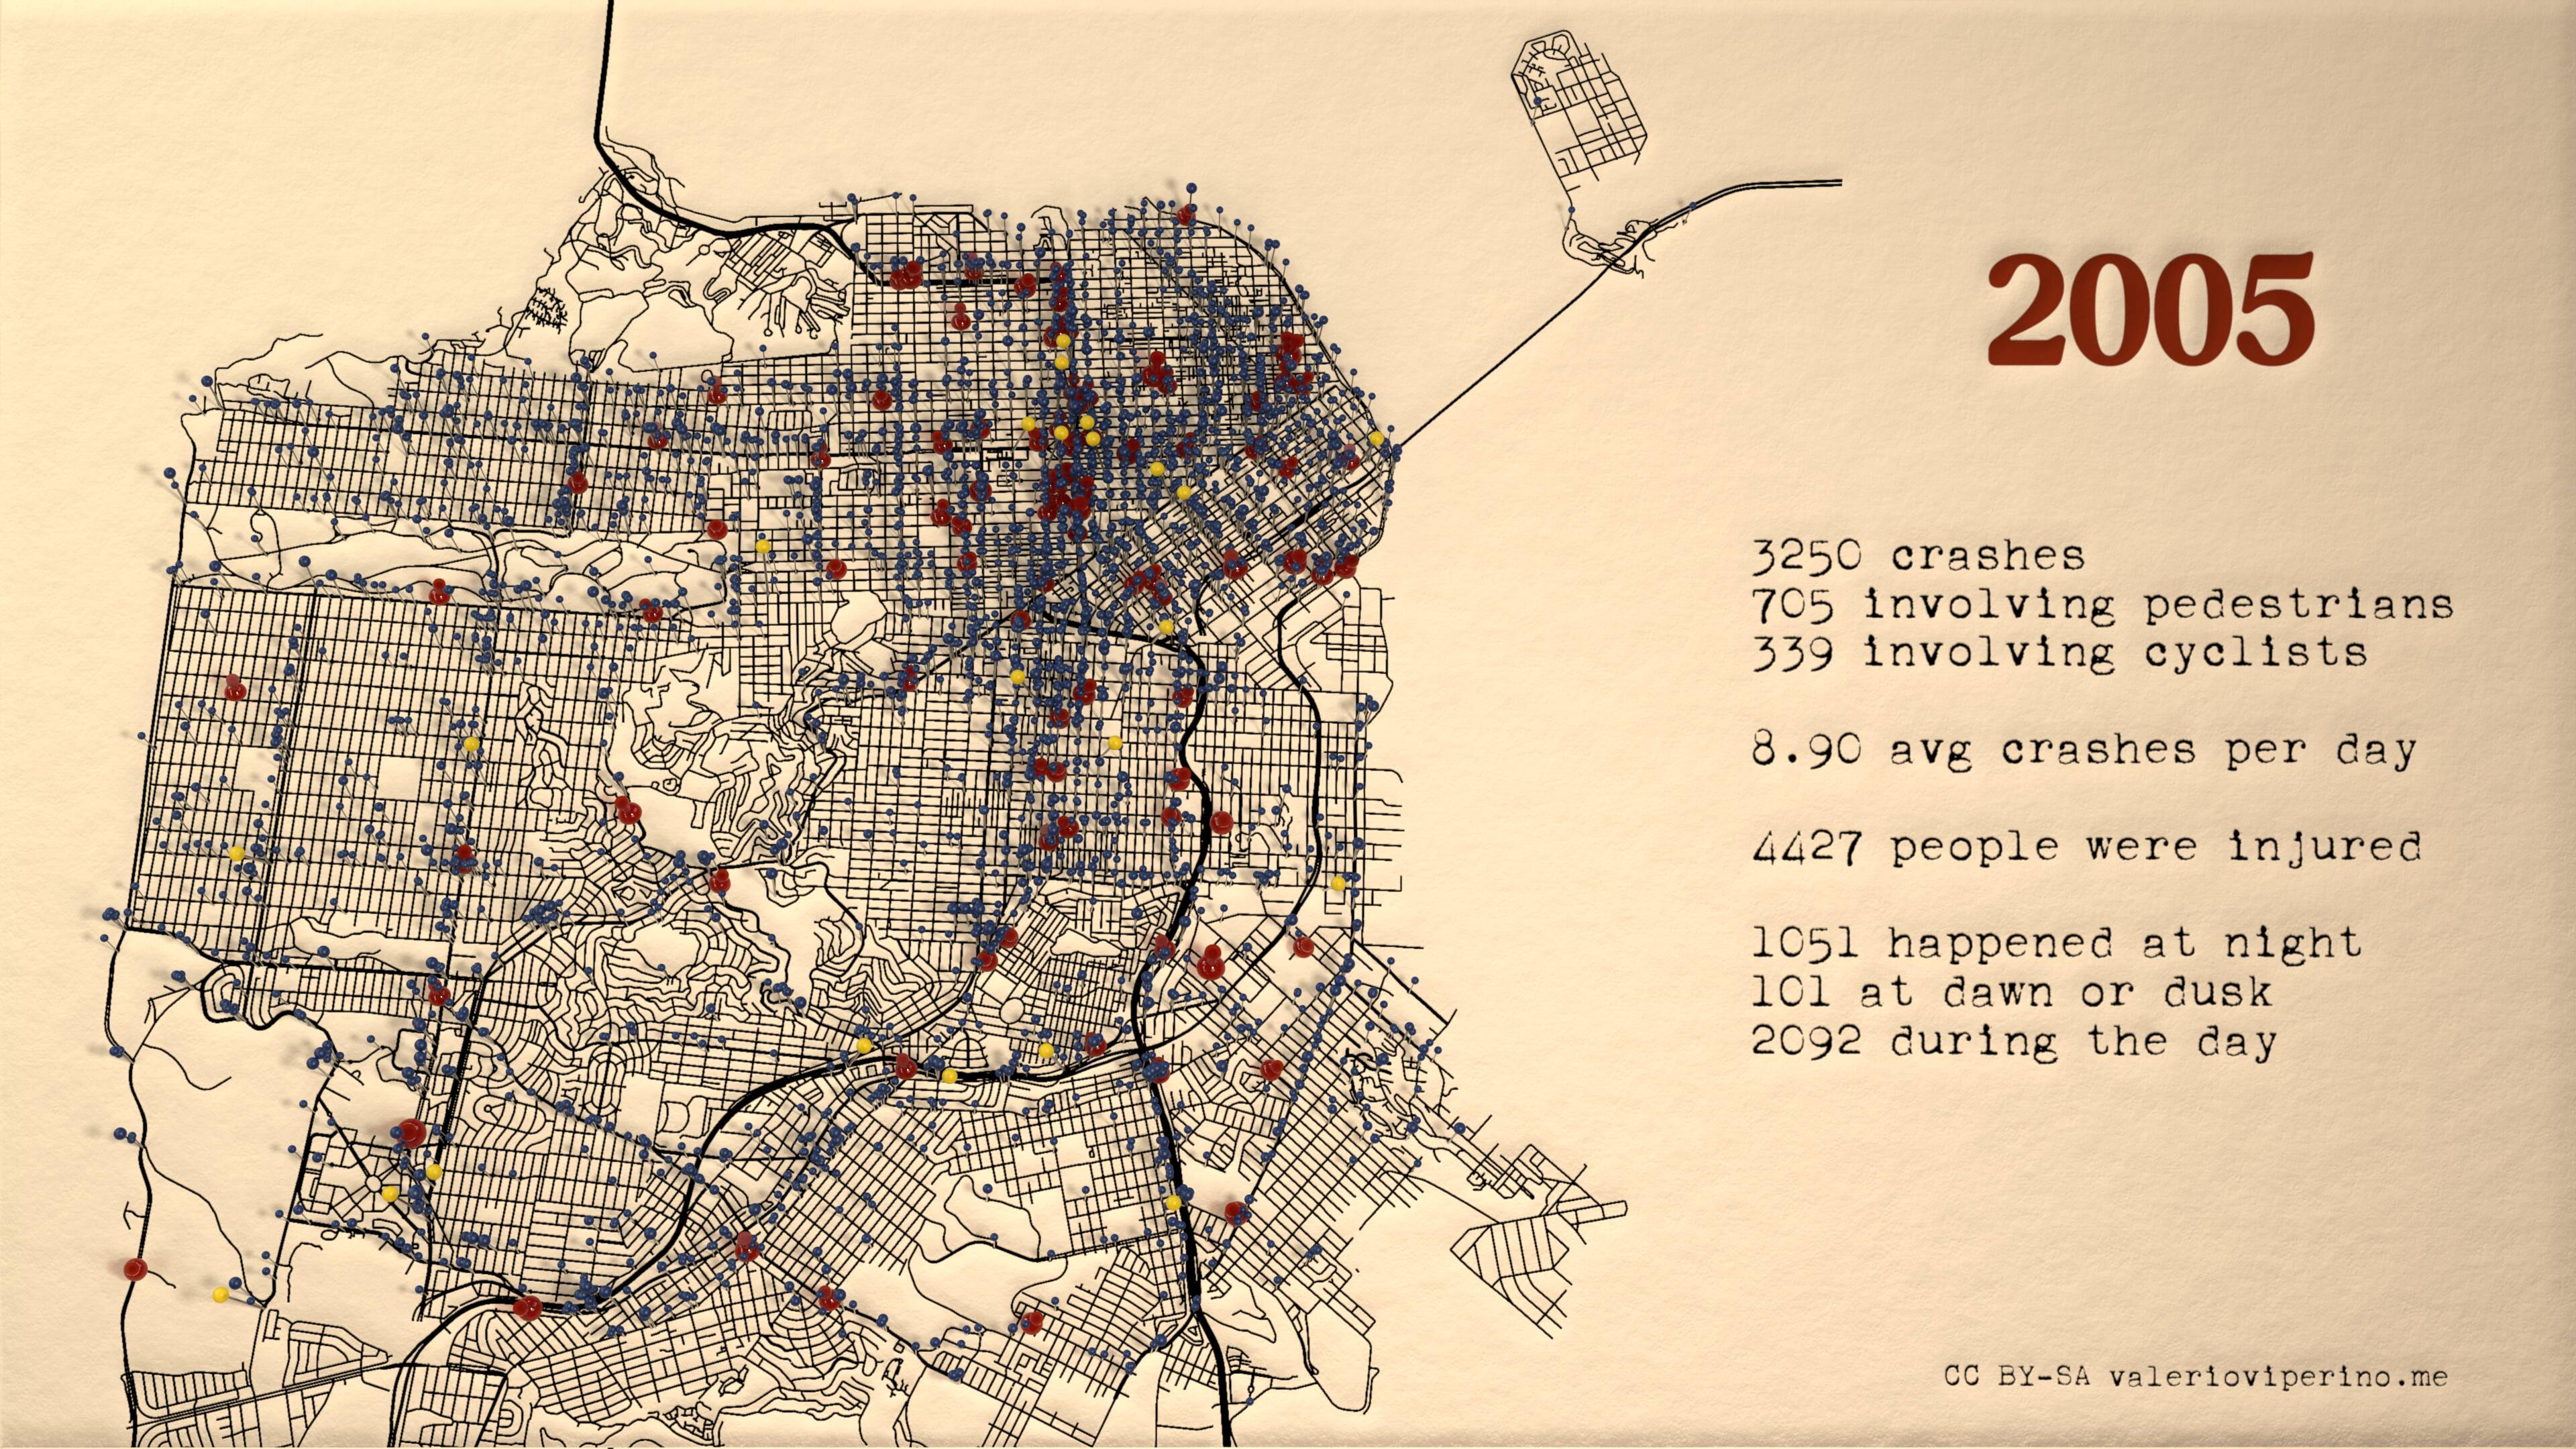
- The number of people injured as result of car crashes went down over the years.
- From 4427 in 2005 to 3140 in 2025
- Did cars get safer? Or are there just more Waymos crashing into each other? :)
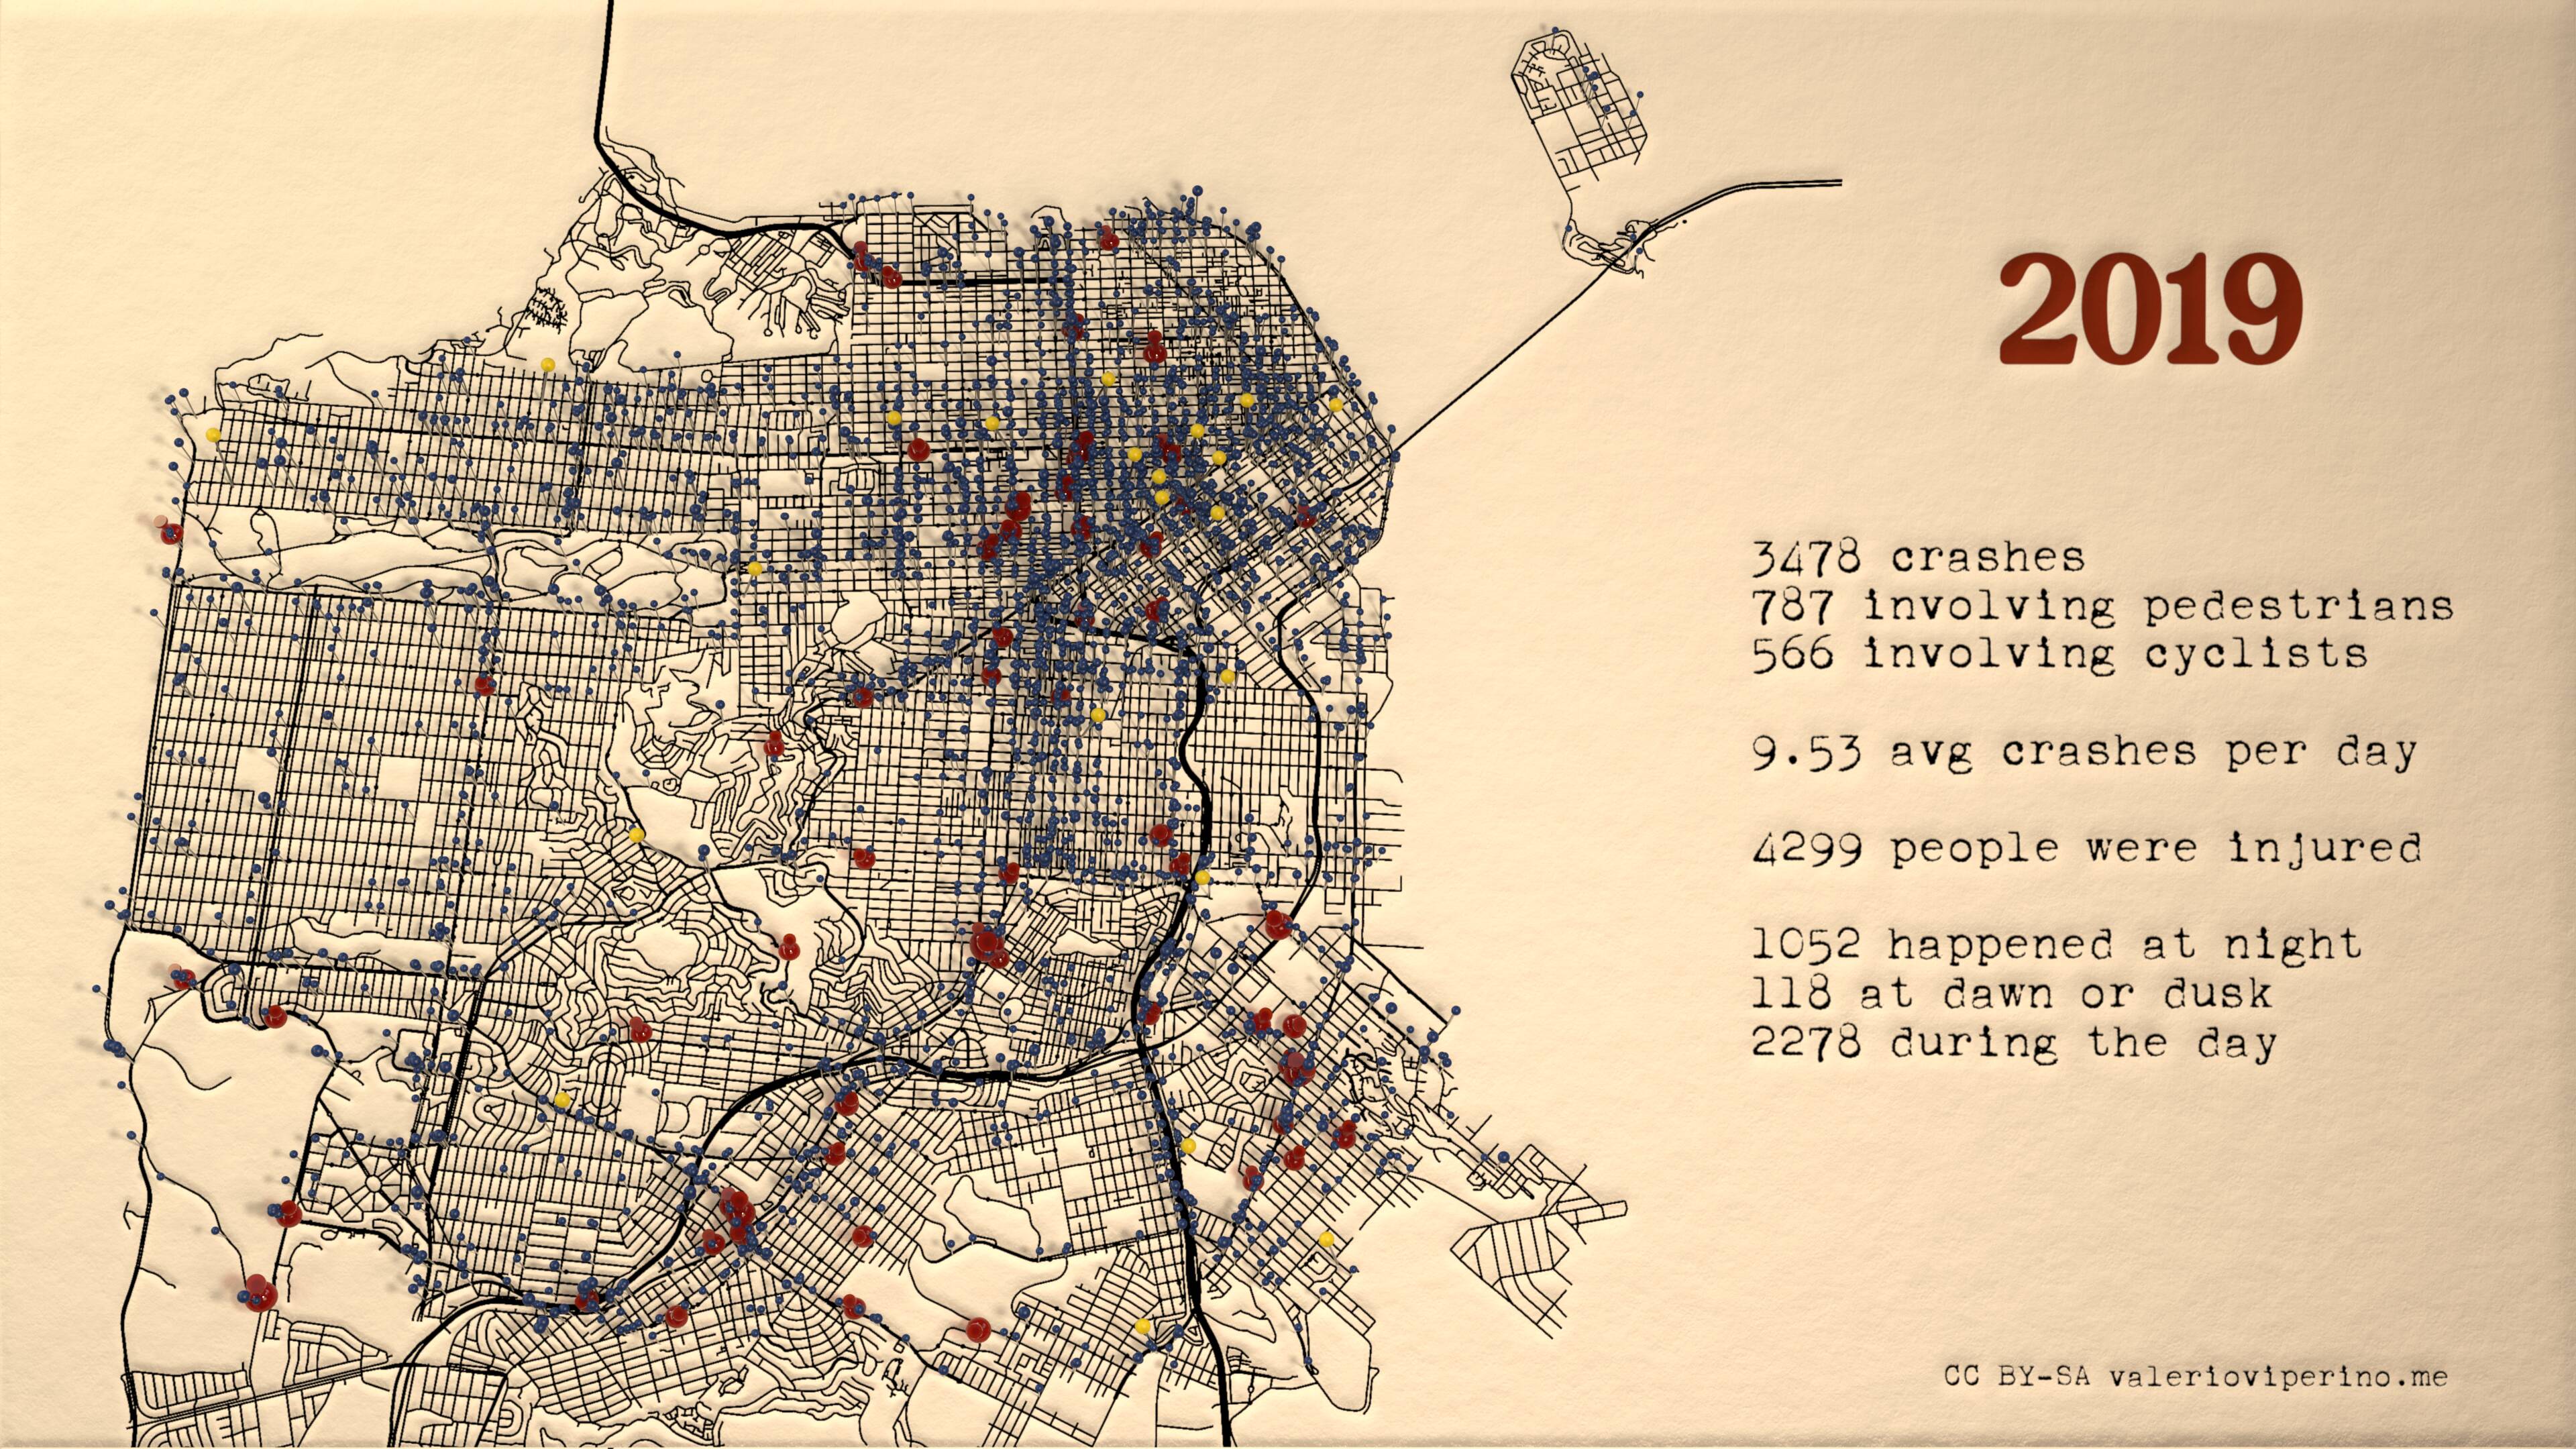
- The worst year was 2017, with an average of 9.38 crashes every day.
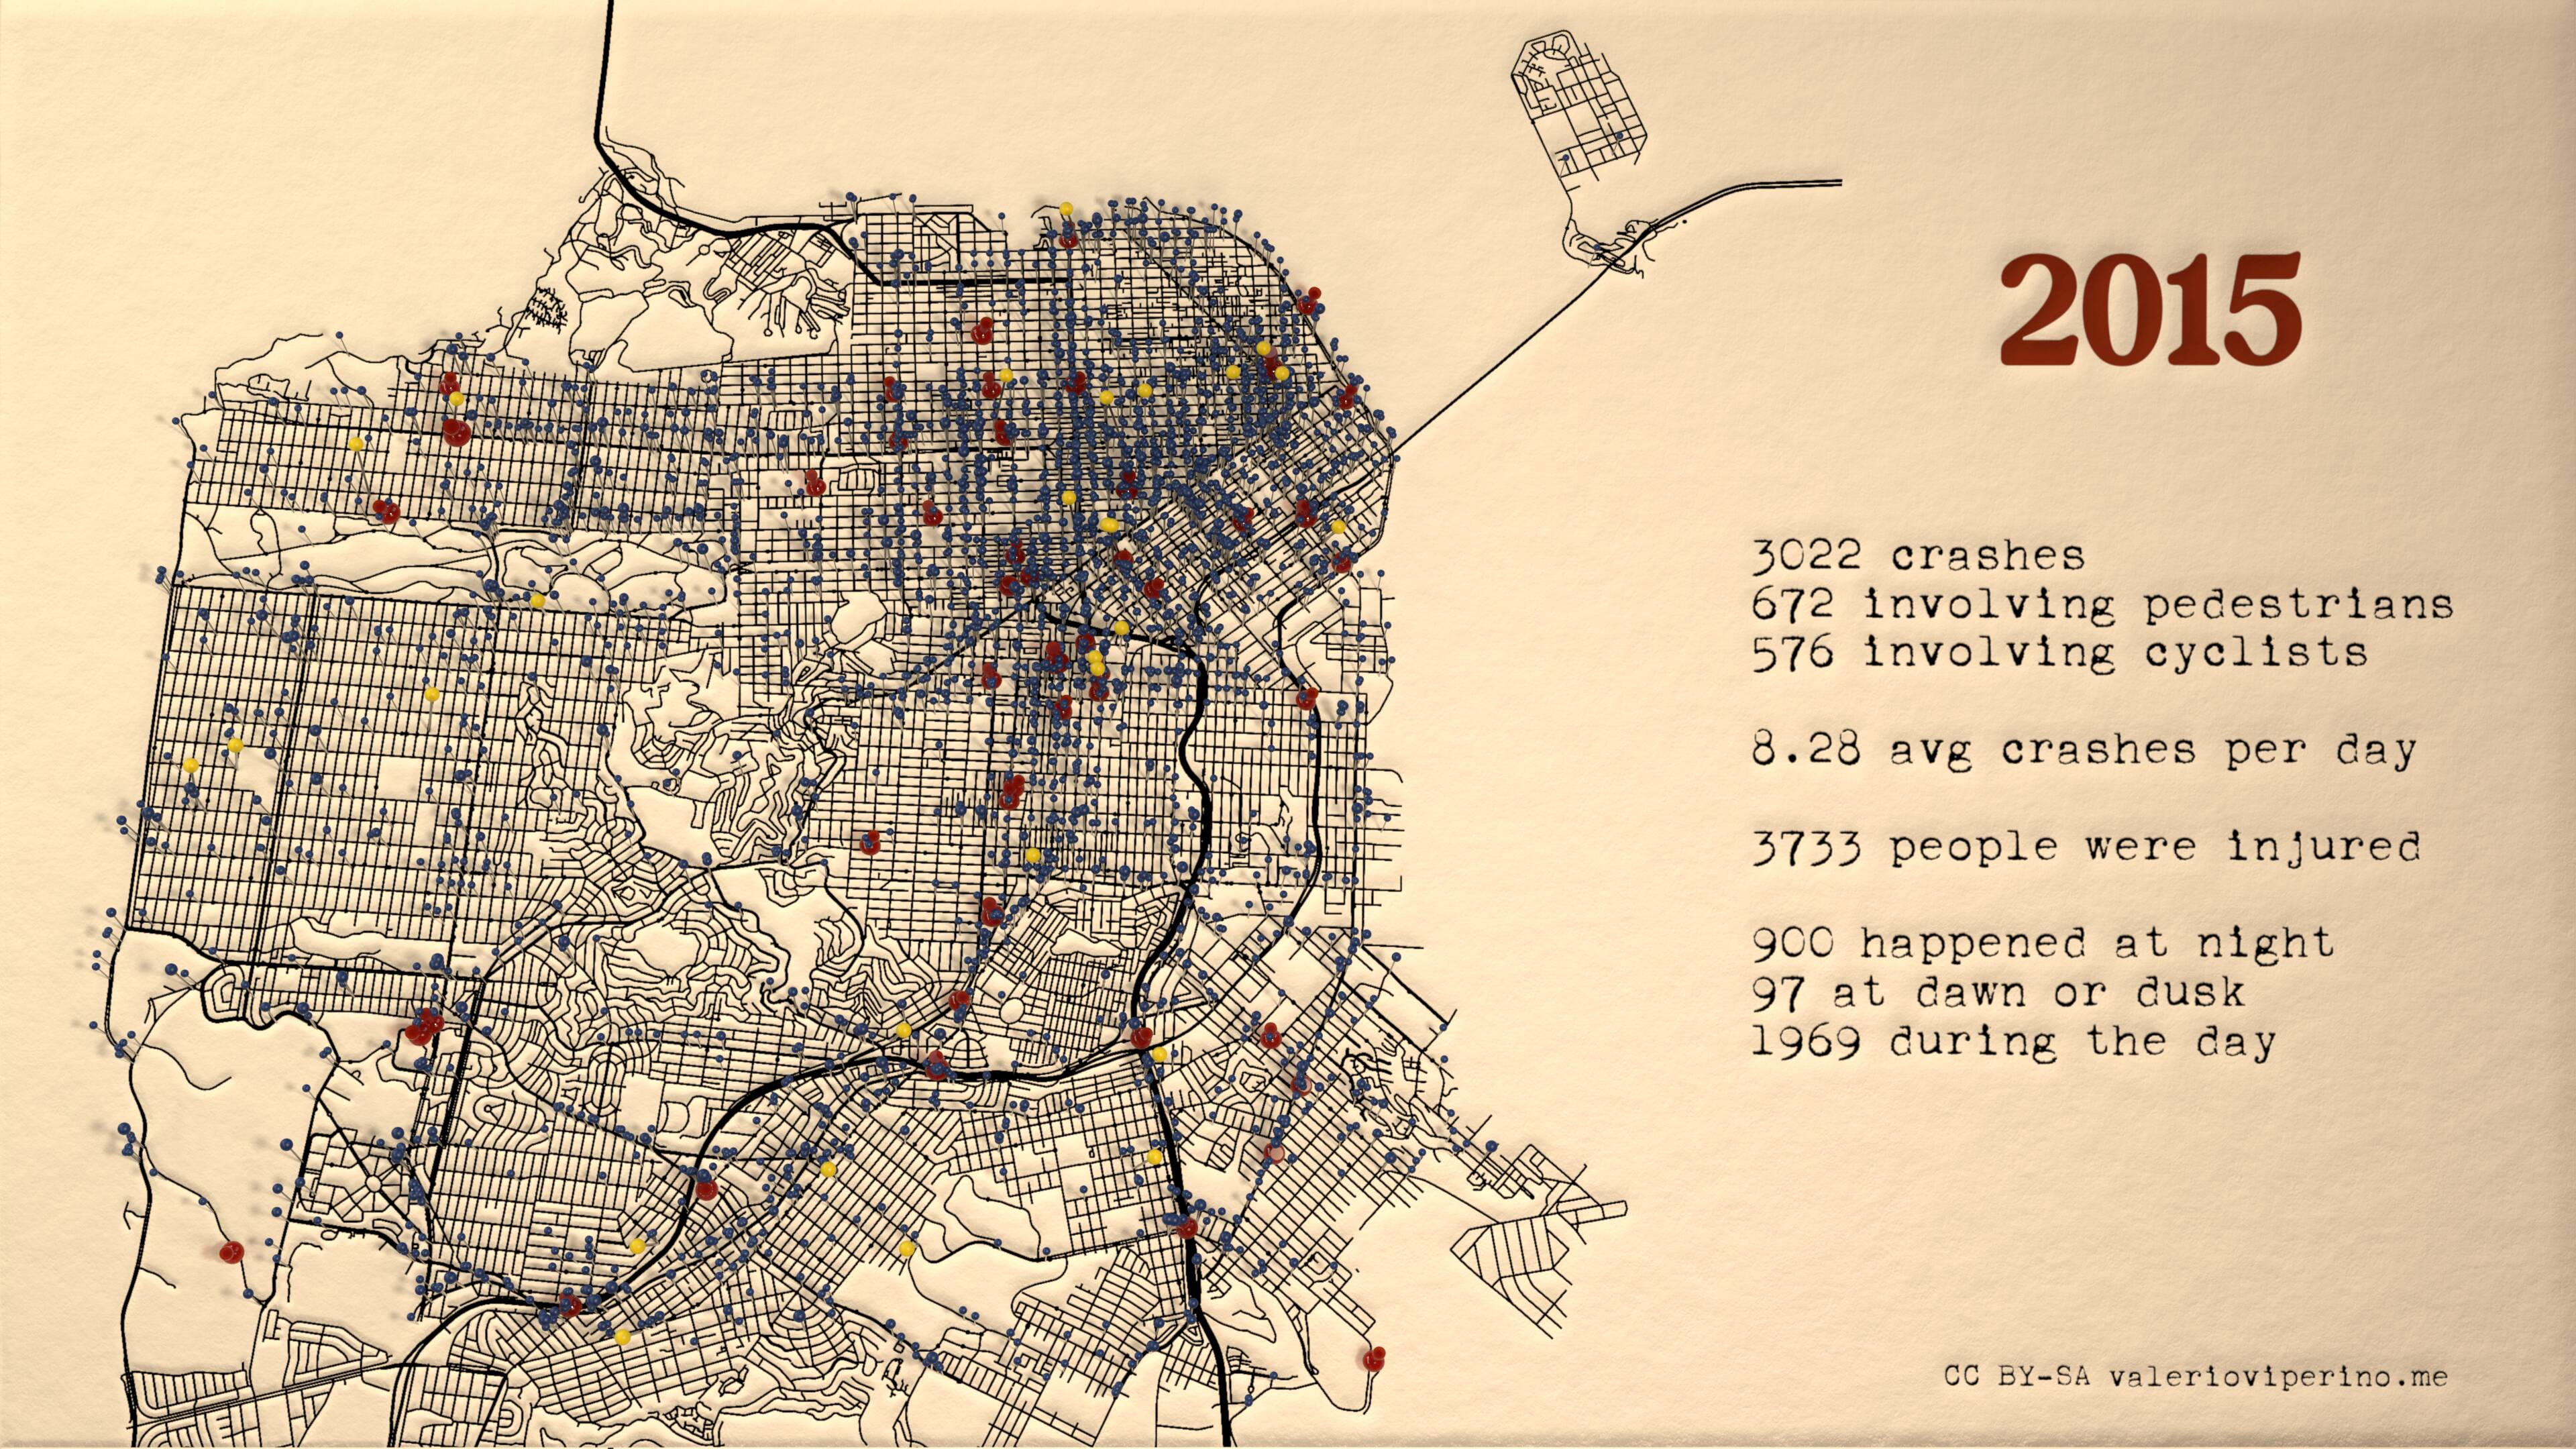
- The number of crashes dipped down gently after Covid, and then it slowly came back up again
- If you want to choose a safe place where to live, the Sunset and Richmond District are miles above the area around the Civic Center (no surprise!). St. Francis Wood looks also particularly quiet!
- For such a small city (121 km² vs 1,572 km² of London, 827'526 residents vs 9.1 mil of London), SF doesn't have ~10 times less crashes, but only 3 times less!
- In 2025, London saw 10'161 collisions, while SF 2'634 (Open Data from Transport for London)
- To further demonstrate this, I'll embark on a quest to pull data from London side by side and compare it.. but for now you can just refer to the online tools of the respective cities. I'll do a follow up post on London as soon as I relocate back there! ❤
TL;DR: Americans' love for cars definitely positively correlates with the number of times they crash them.
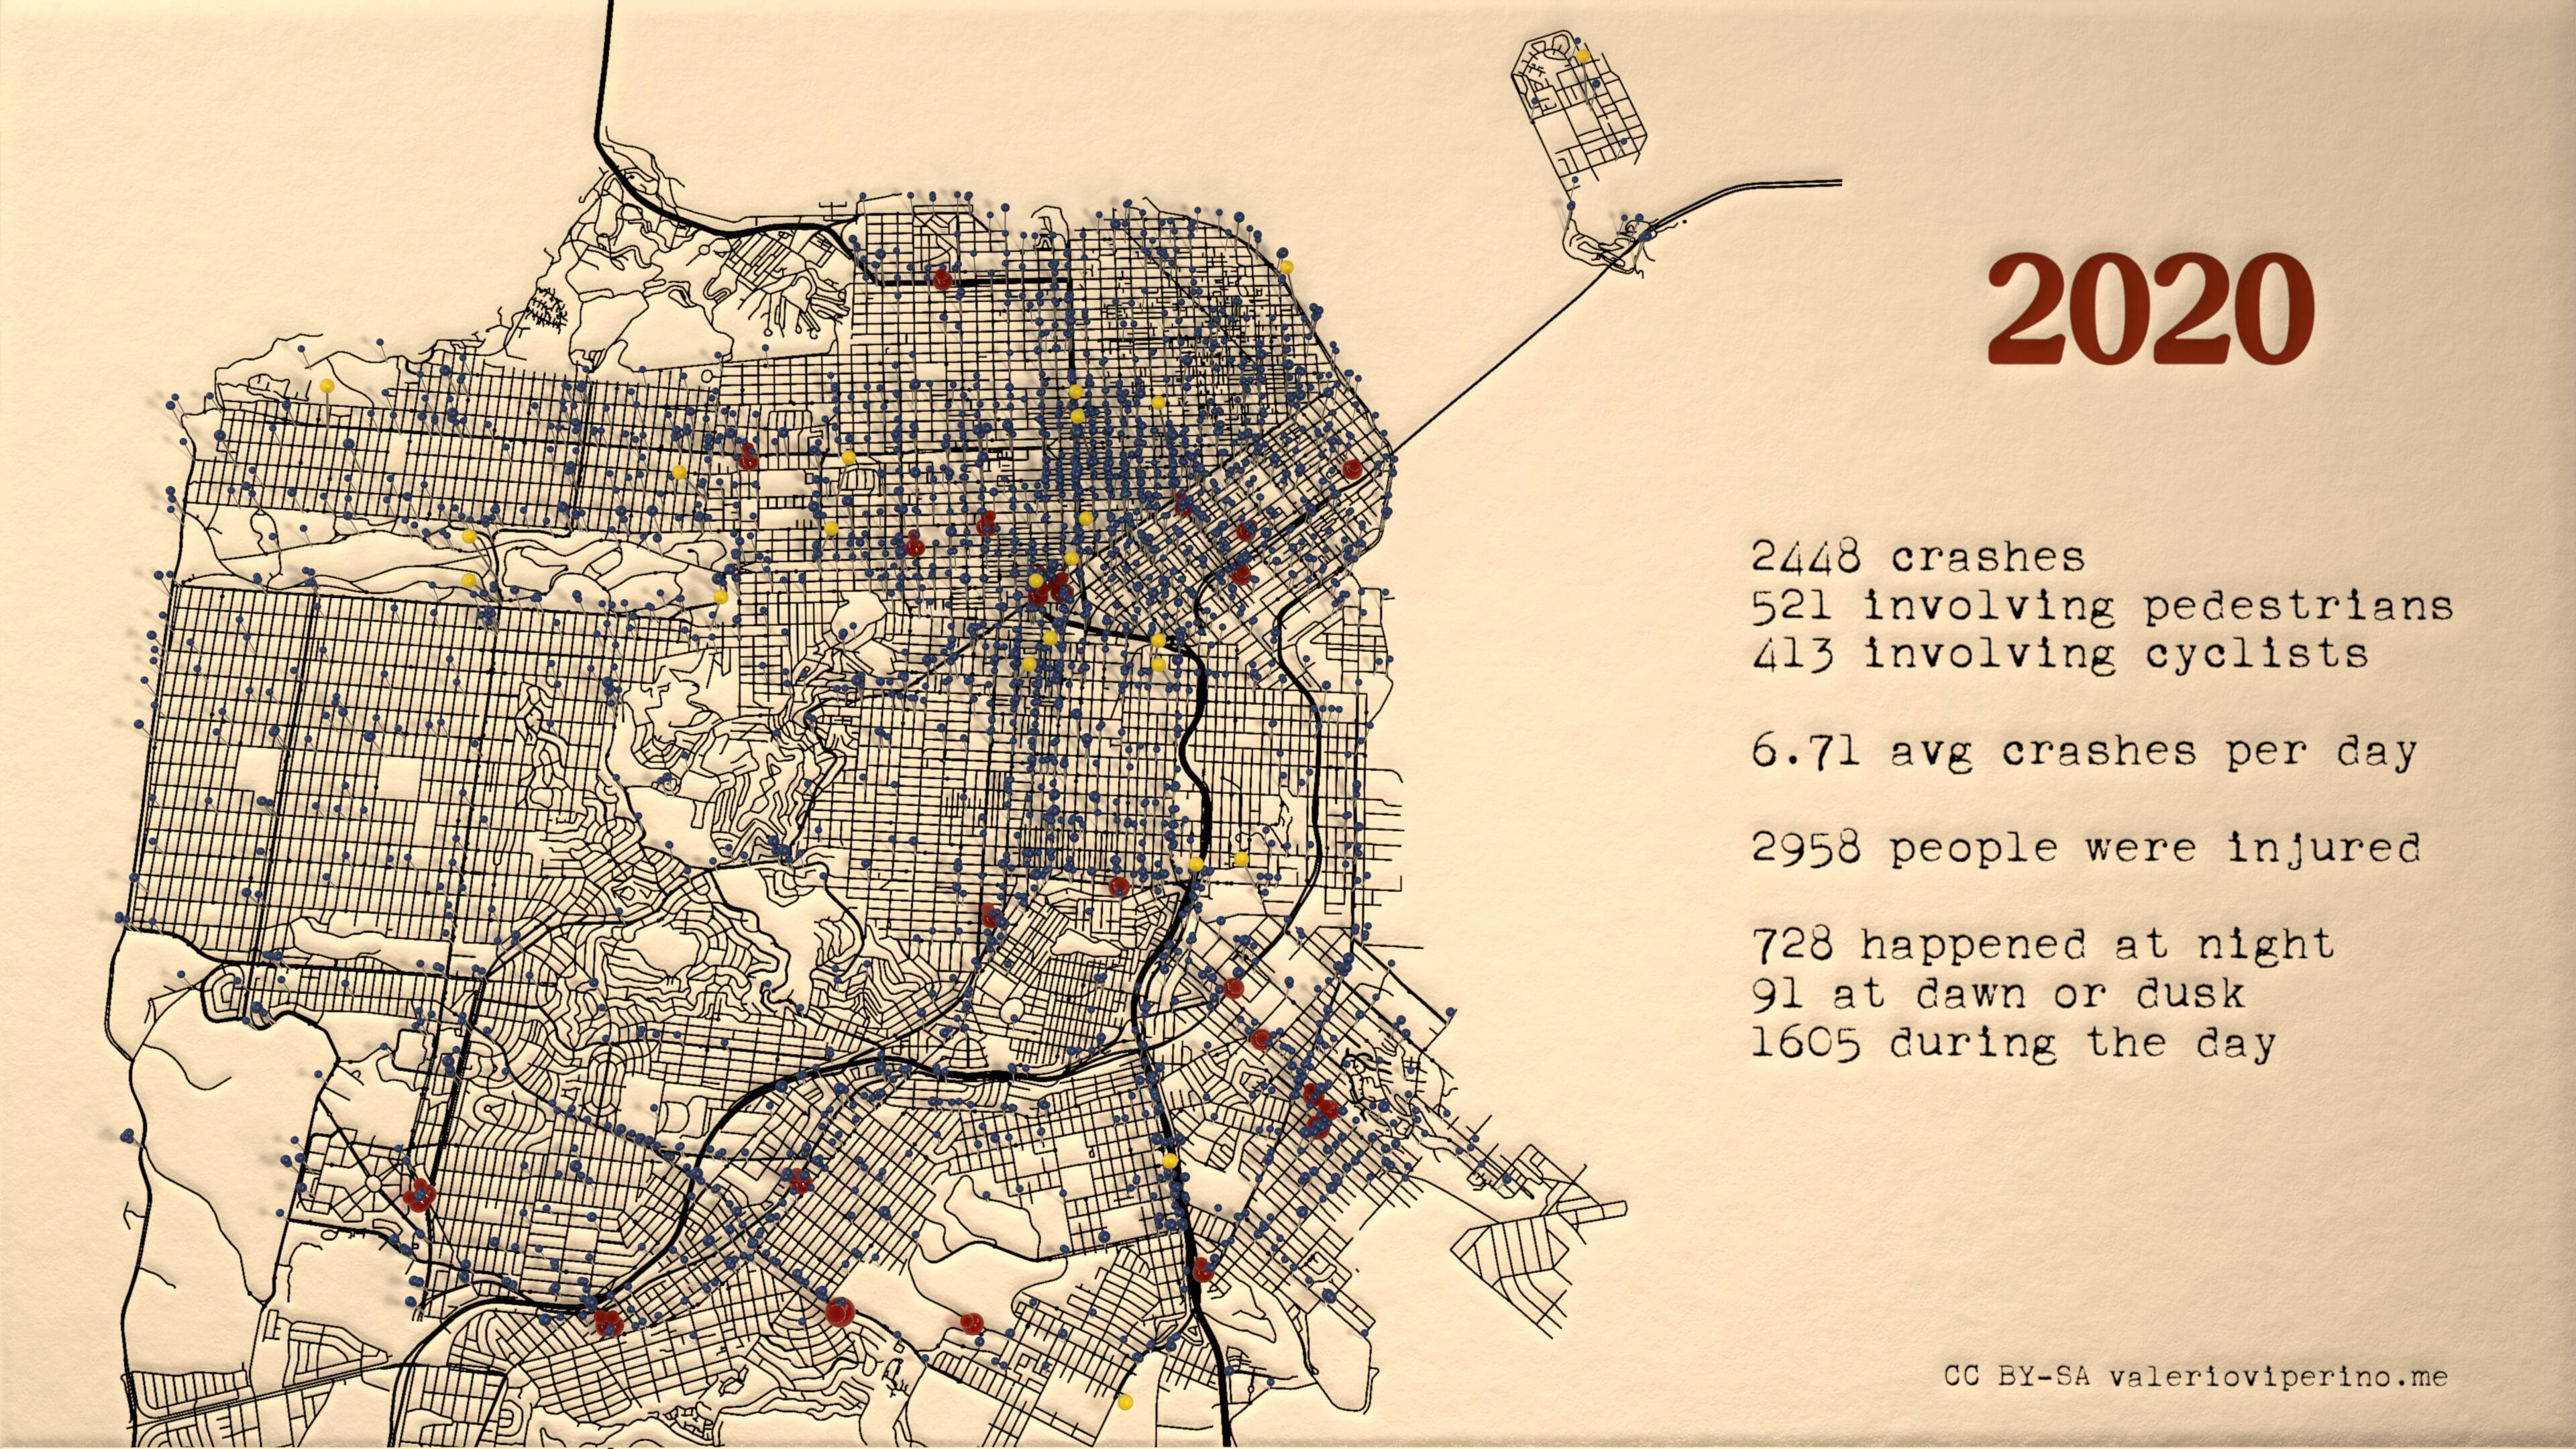
Legend
- Yellow pins: crashes that resulted in nobody being injured
- Blue pins: crashes with at least 1 and less than 4 people injured
- Red pins: crashes with more than 4 people injured
Notes on the data
The source for the crashes data is https://data.sfgov.org/Public-Safety/Traffic-Crashes-Resulting-in-Injury/ubvf-ztfx/about_data.
Each row in the original data represents a collision.
I have removed from the original dataset entries whose features had no geometry, e.g.:
crashes_skipped = [
    f for f in data['features']
    if f.get('geometry') is None
]
You'll notice that the sum of crashes happened at night/dusk/dawn/day doesn't correspond to the total amount. That's because some entries in the source data are unlabeled.
Each second, one year of crashes
Stills

Pre COVID..
..and post COVID:
Behind the scenes
The AI-generated slop that fills the web these days made me realize that I care deeply about a good BTS, almost as much as I care about the final work presented. If you too, my dear reader, share this sentiment, here's a few notes documenting the progress of this project.
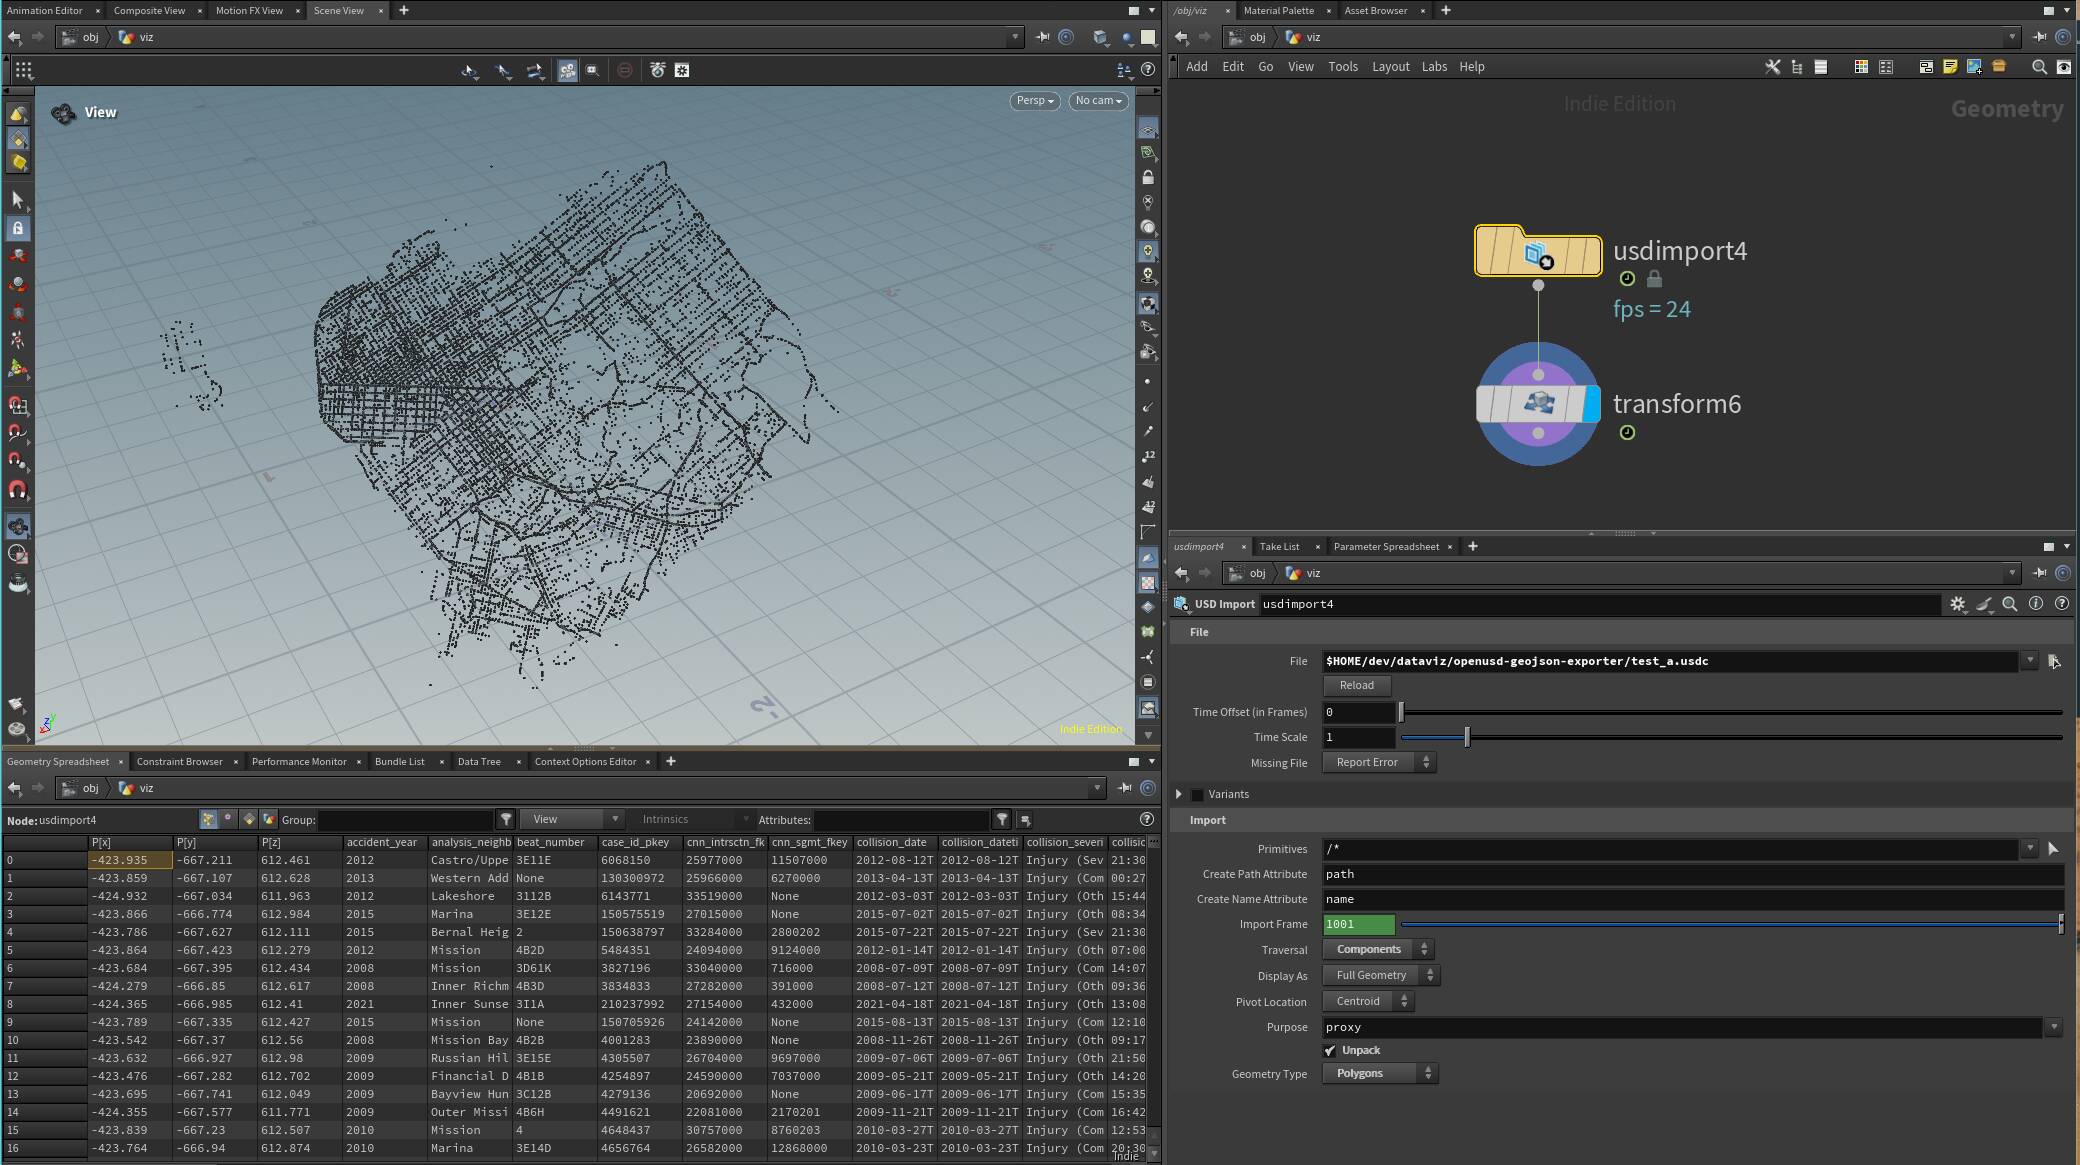
I've already done similar #geospatial work in the past (see Through the streets of Rome and my Houdini Geospatial Tools repo) so my pipeline at this point is quite solid. To spice things up and push myself to learn a bit of USD, this time I wrote a CLI to help me with the conversion from GeoJSON data to USD (I hope to be able to release soon as open source software!). Having just a few .usdc files lying around made it so that I could import all geometry as-is in Houdini via the built-in USD Import node, without the need to have a conversion step inside Houdini to read the GeoJSON and build Houdini's native geometry. The benefit of this workflow is that I still have access to all the GeoJSON properties that I care about in the form of USD Point Attributes, but I can filter out the attributes I don't care at time of exporting the .usdc file, which makes the final USDC crate size go from 200MBs to just around a couple of MBs.
The CLI looks like this:
vv-geojson-exporter \
    -i Traffic_Crashes_Resulting_in_Injury_20260102.geojson \
    -o 20260102-points.usdc \
    -m 1 \
    -s 1000
Where -m sets the meter per USD unit to 1 and -s scales everything by a factor of 1000.
Original proof of concept importing the .geojson points
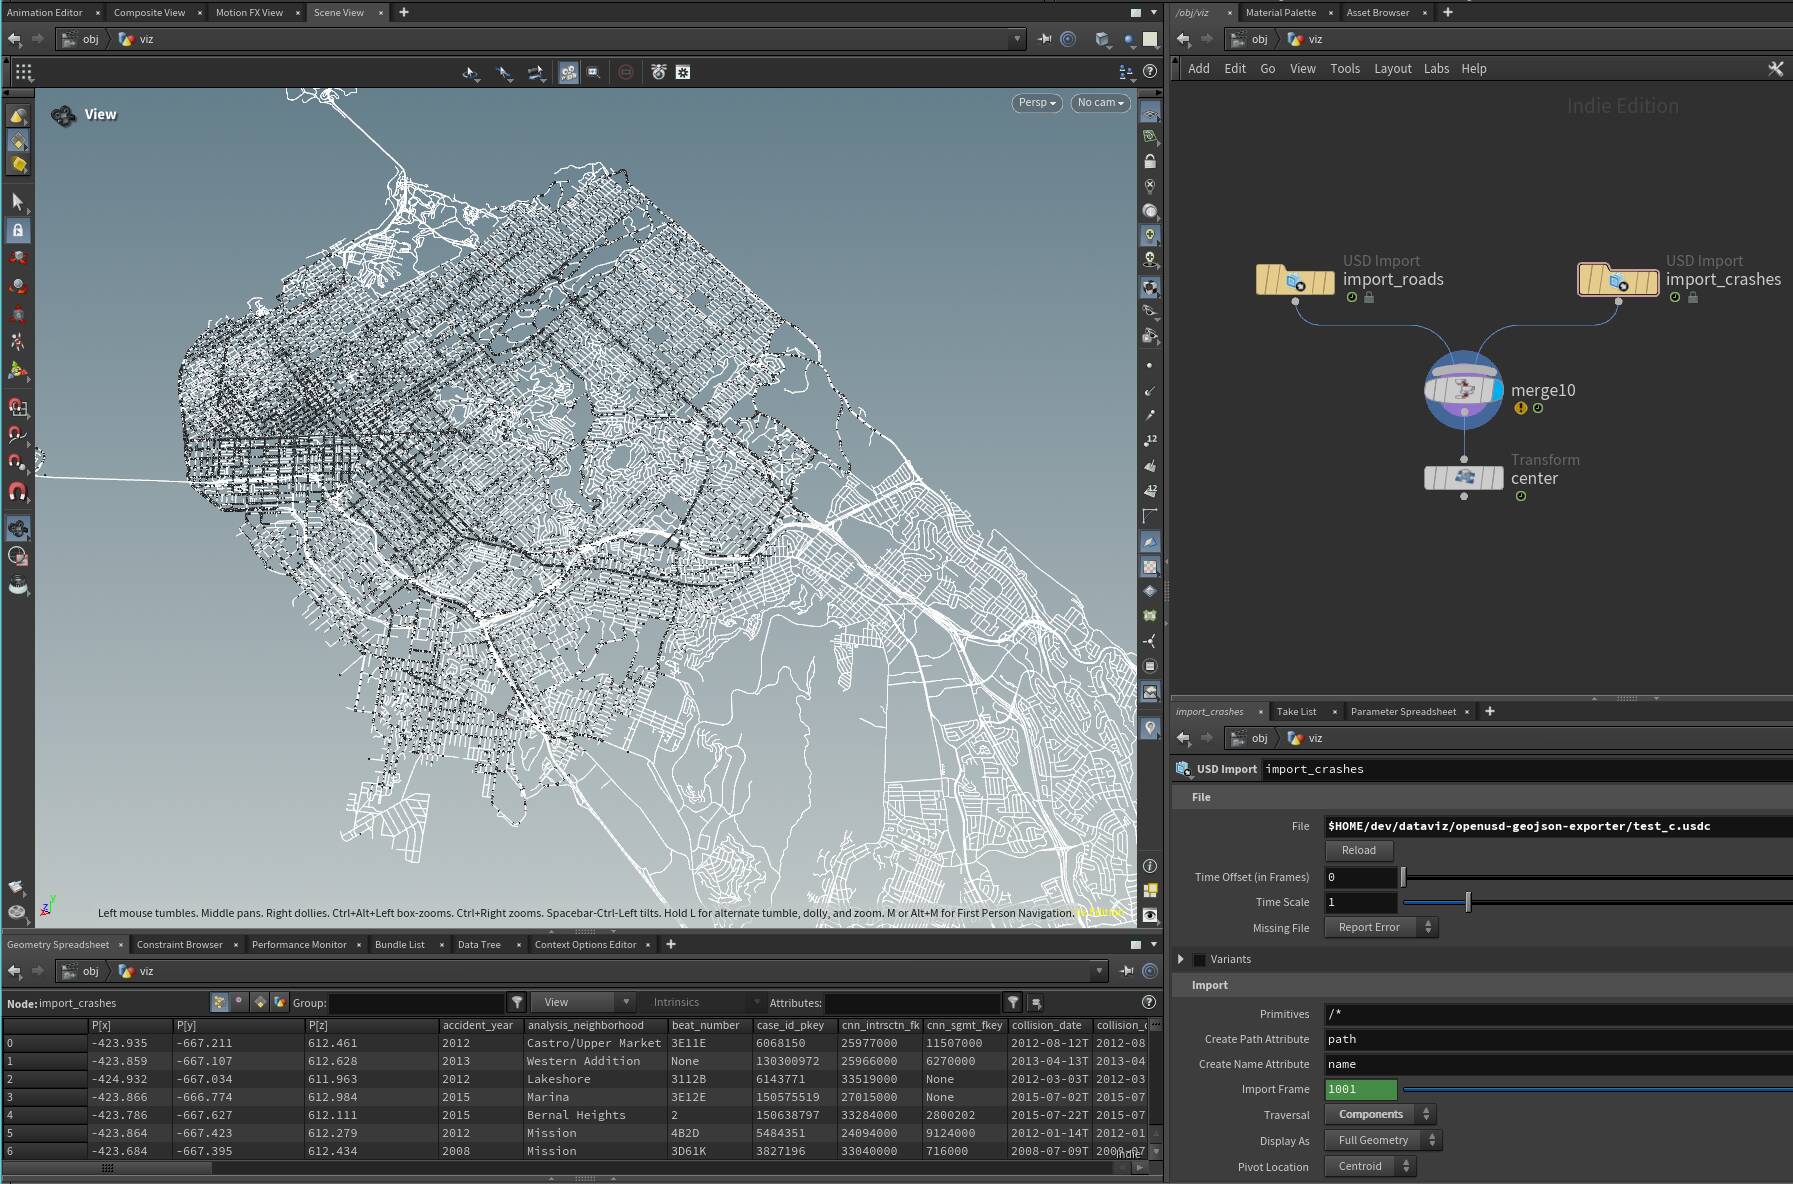
Extending support to GeoJSON line strings, so I can import streets too
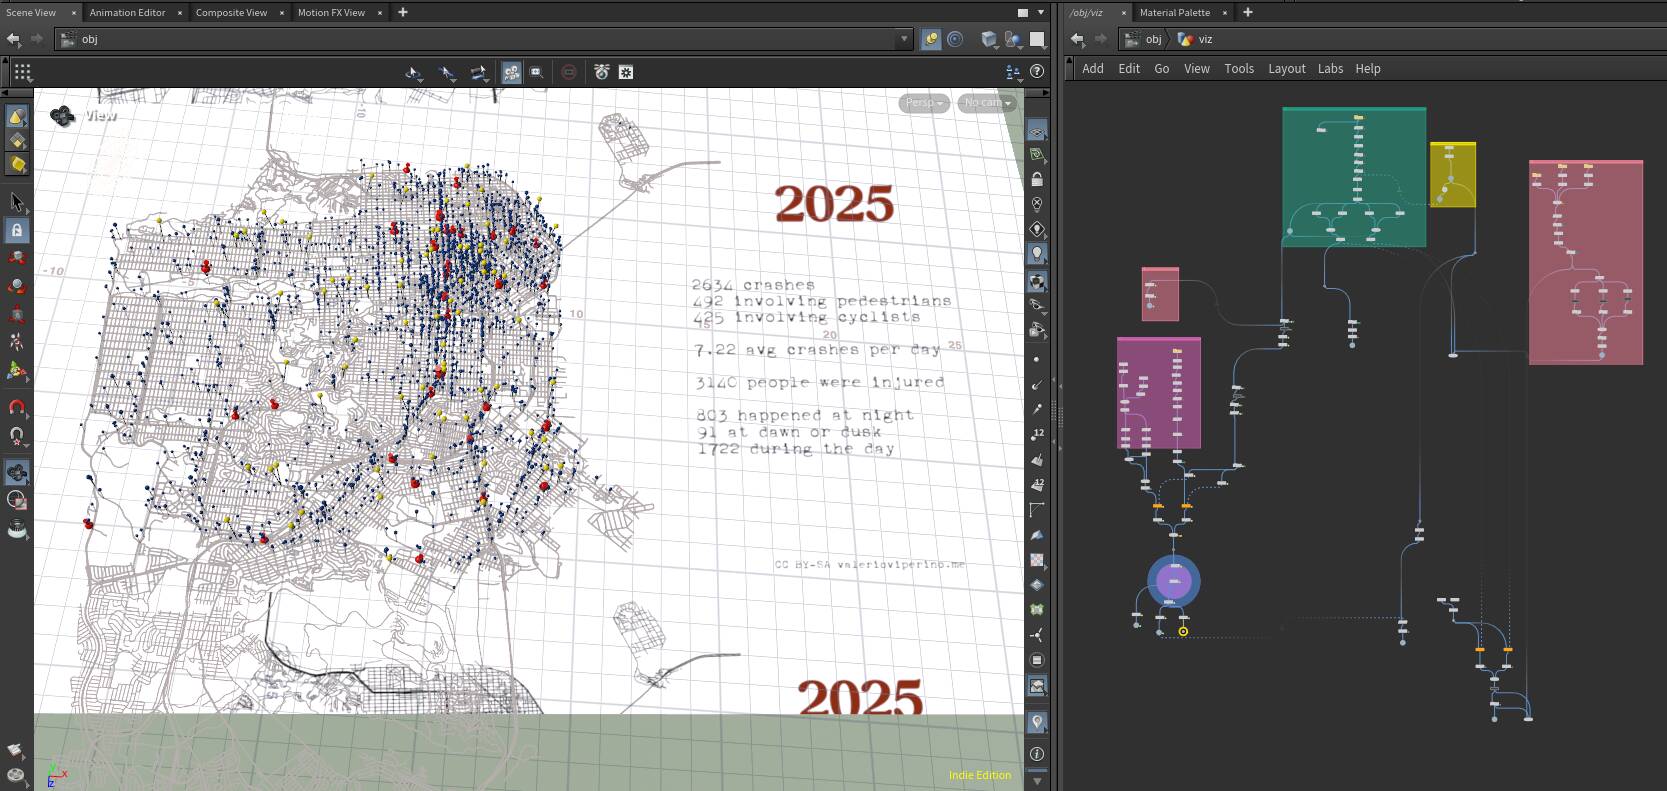
A look at the final SOP network after instancing the geometry on the points
For the text elements, I found myself going back to Copernicus more and more. In particular, COPs ability to quickly pull detail attributes from my SOP geometry proved to be essential for keeping everything fully procedural!
Extract from Copernicus showing the text generation

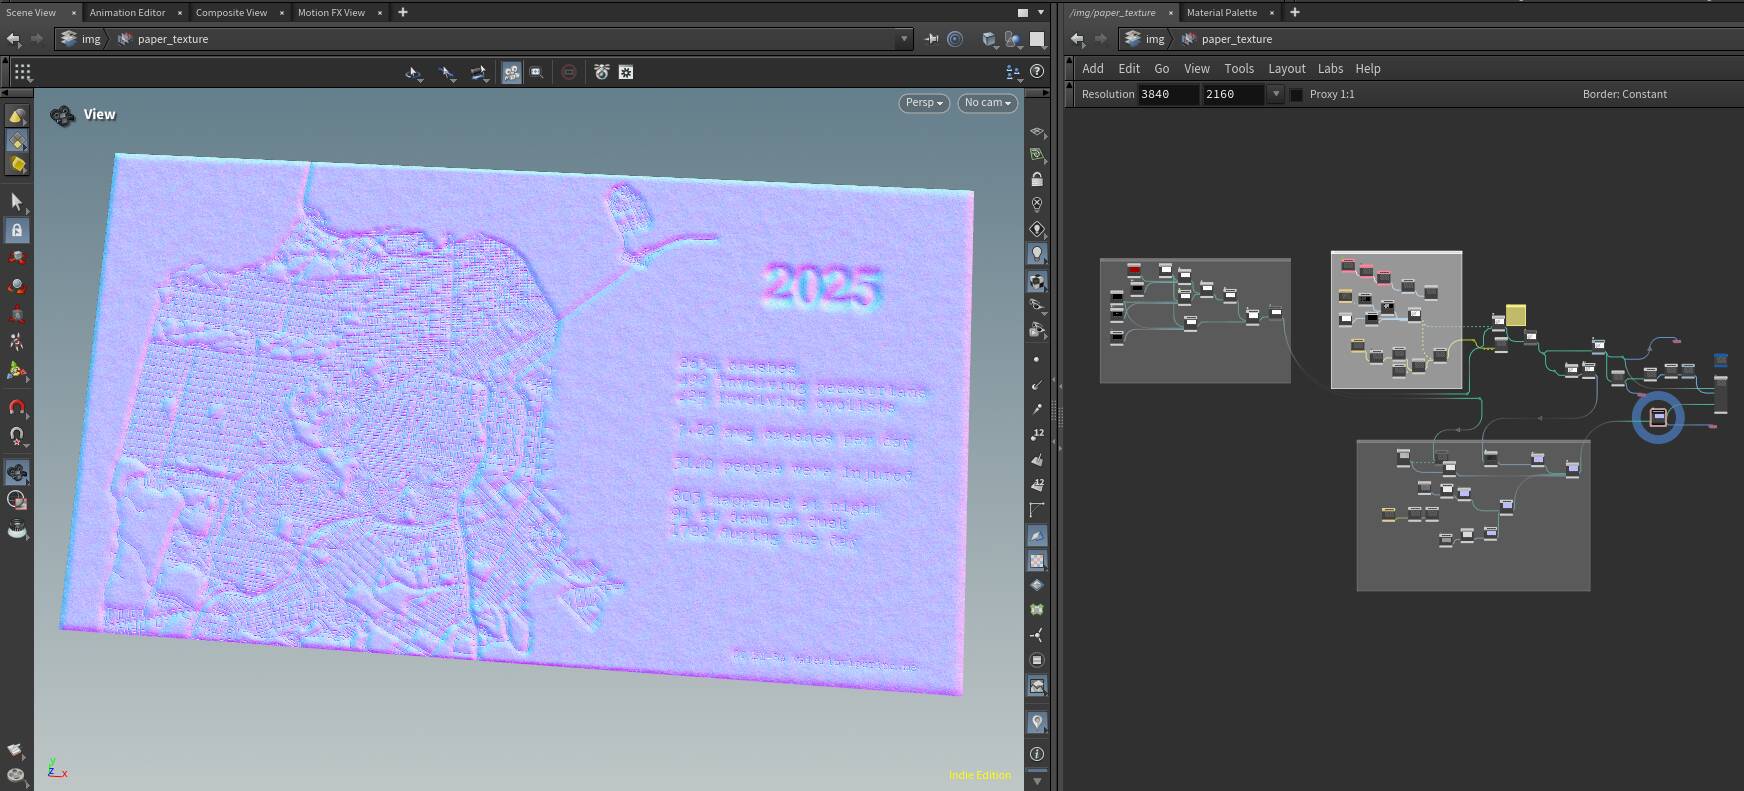
Normal maps generation adds a subtle touch of embossing to the background paper
In terms of visual methaphor, I originally played with "good old" cubes extruded vertically. While some stills looked gorgeous, in the end I felt I was doing more of what I've already done (and what mapzilla also brilliantly executed multiple times!) so I decided to try to explore more novel ways to visualize the data.
Early studies that visualized on the Y axis the amount of injured people

Since Nuke Indie is ridiculously expensive, I found myself doing quick precomps in Natron!

Sometimes I just ask myself weird questions like: "how would it look like using.. wax blobs?"

Study experimenting with the idea of using different pins to represent crashes
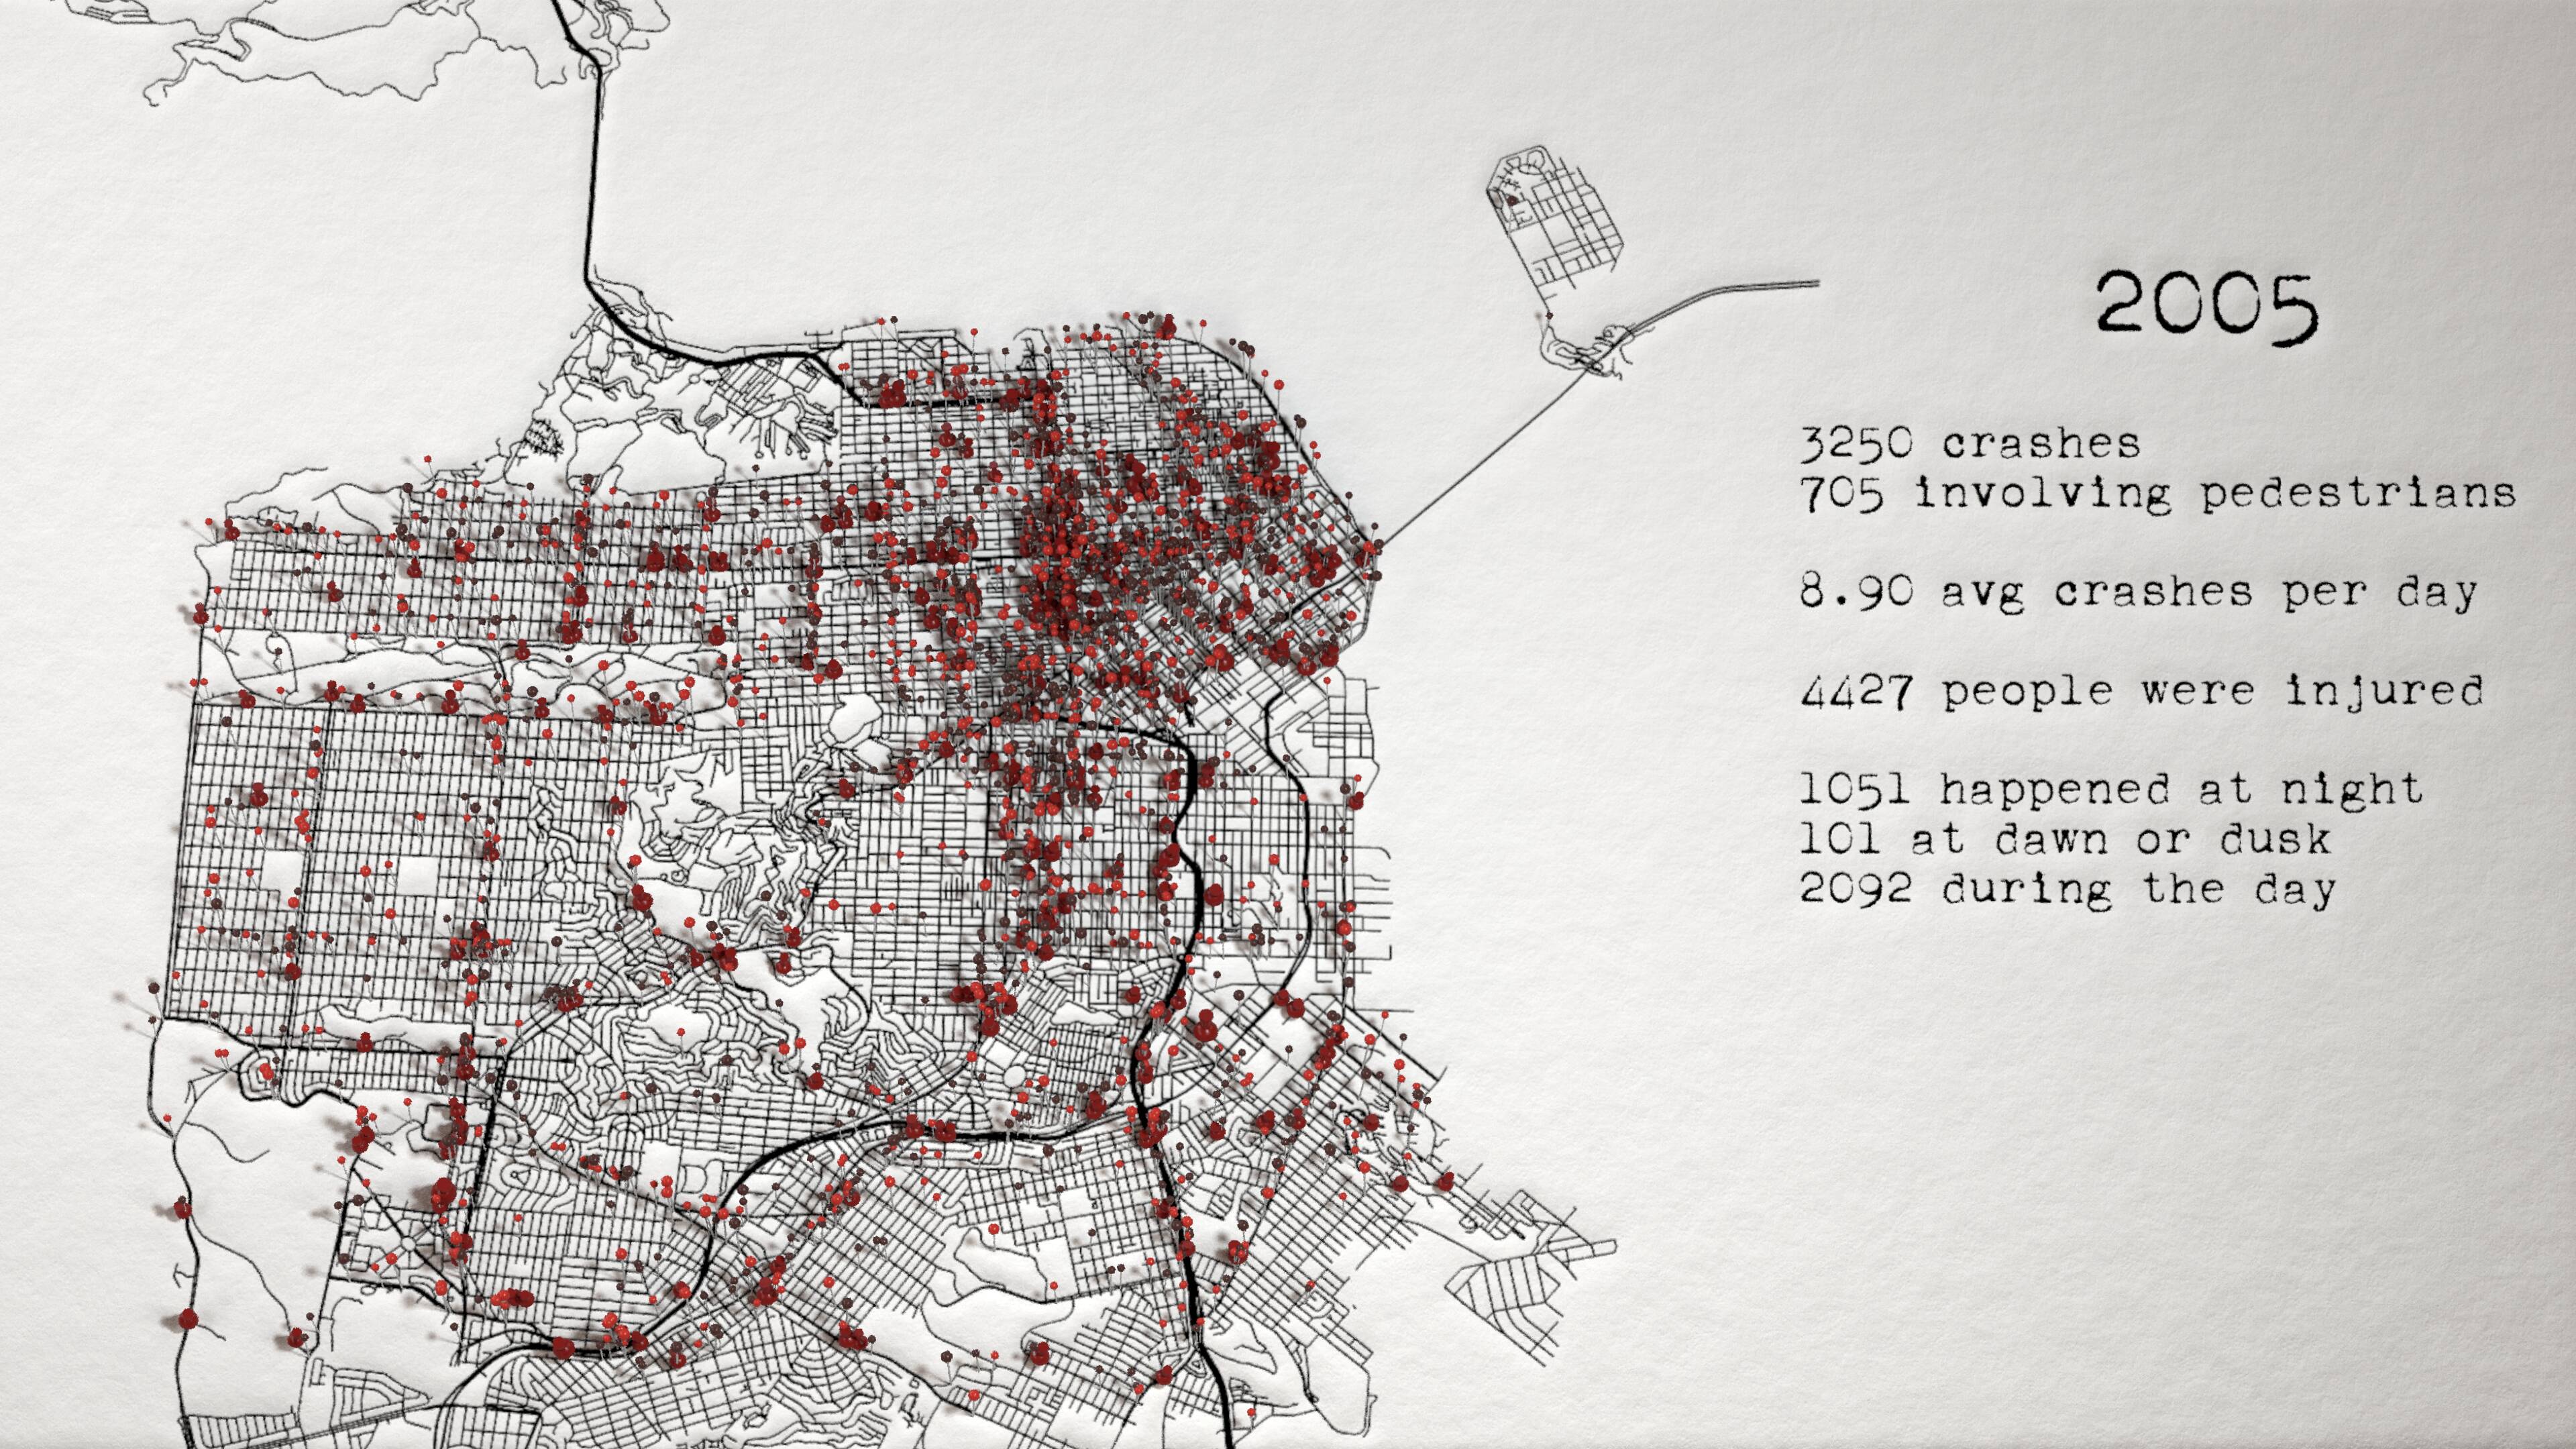
Final version
Credits
3D Assets:
- "CC0 - Pin 2" (https://skfb.ly/osn87) by plaggy is licensed under Creative Commons Attribution (http://creativecommons.org/licenses/by/4.0).
Fonts:
- Milky Vintage, Desktop license
- Tox Typewriter, donationware
Emotional support (plus creative direction):
- My beautiful and loving wife