Frozen in Time
Preamble
In June 2022, I delivered small workshop at Goldsmiths University of London, aimed at helping the hackers of the Computational Arts MA better understand the beauty of working in Houdini, and how it can help their creative practice (slides and materials available here). While prepping the slides and finding some good examples of ways that Houdini can be used as tool for exploring data (and not just for creating 3d content), I thought of touching briefly on the dataviz side of things.
Having used Houdini in the past exactly for its ease of exploring datasets (without writing too much code), I looked for interesting datasets that I could leverage to demonstrate its capabilities.
I have worked with data coming from Copernicus a few times, and so it was a natural place where to start looking.
After a bit of searching, I found a very interesting and comprehensive dataset that provides
[...] in situ and remote sensing derived glacier changes from individual glaciers globally. The dataset represents the latest homogenized state-of-the-art glacier change data collected by scientists and the national correspondents of each country as provided to the World Glacier Monitoring Service (WGMS).
The data is actually divided in 2 datasets:
- glacier elevation change series from the geodetic method
- glacier mass-balance series from the glaciological method
Since I'm not a scientist, and my approach is purely driven by curiousity and creativity, I intuitively sensed and arbitrarely decided that the second dataset was a bit more approachable, especially in light of the climate change awareness that my generation has learned to live with.
Exploration
I started cleaning up exploring the data, and I stumbled across some records and numbers that felt familiar. It was the bits of data regarding the Careser glacier, in the central Italian Alps.

Careser Lake, image from Wikimedia
Somehow that name rang a bell, but I couldn't figure out exactly why. I did my bit of duckduckgo-ing, and I quicky realized that I had been there. Like, I physically walked close to the glacier back in my teenager years as a scout, when with my group we climbed the Mt. Cevedale. Immediately that struck a chord, and I decided to focus on exploring the life of that glacier. Turns out¹ that the Careser is a great glacier in terms of data coverage:
In addition to having one of the longest and richest observation records among the Italian glaciers, Careser is unique in the Italian Alps for its 46 yr mass balance series that started in 1967.
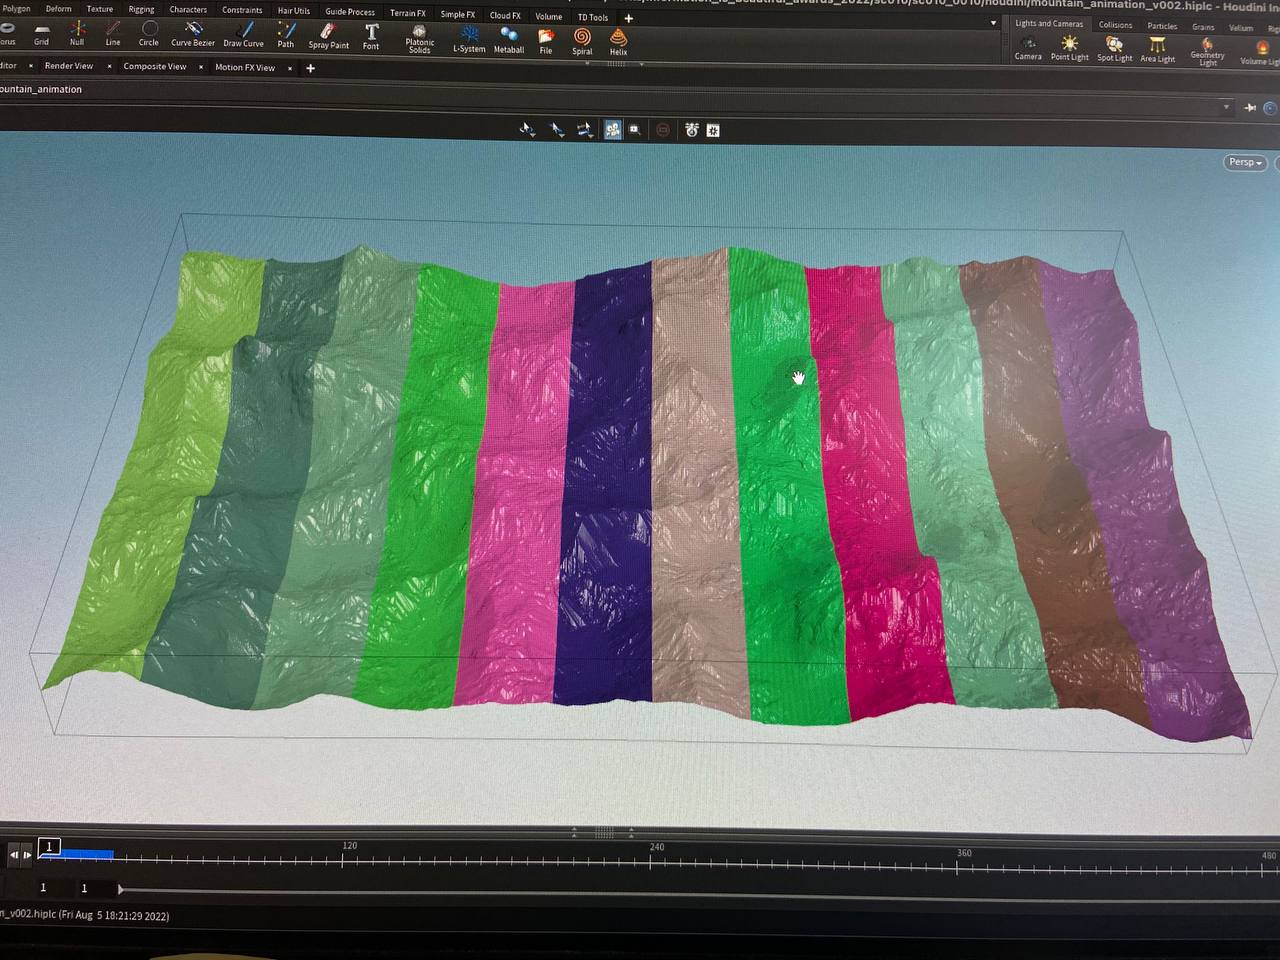
It felt like a match made in heaven. I finished prepping the workshop, and ended up making a (simple) 3d visualization of the change in glacier area from 1967 to 2012. The result was a 3d mountain landscape, developing from left (1967) to right (2022) that had more or less ice on it depending on the 'AREA' of the dataset.
This was a very simplistic approach, but my point was just to show how to turn some numbers into pixels, and how to think out of the box, so it was good enough for the workshop and to show how to read and generate geometry from a csv file with just a few lines of VEX code.
Data that resonates
A few days after the workshop though, I felt a thirst for going more in depth. I had developed a more intimate connection to that data, after looking at the sad truth expressed both in the numbers and in the visualizations: the glacier area was slowly but inevitably decreasing.
I started playing around with the idea of exploring the mass balance changes over the years via an animation. I spent some time trying to understand the different ways that these numbers could be interpreted.
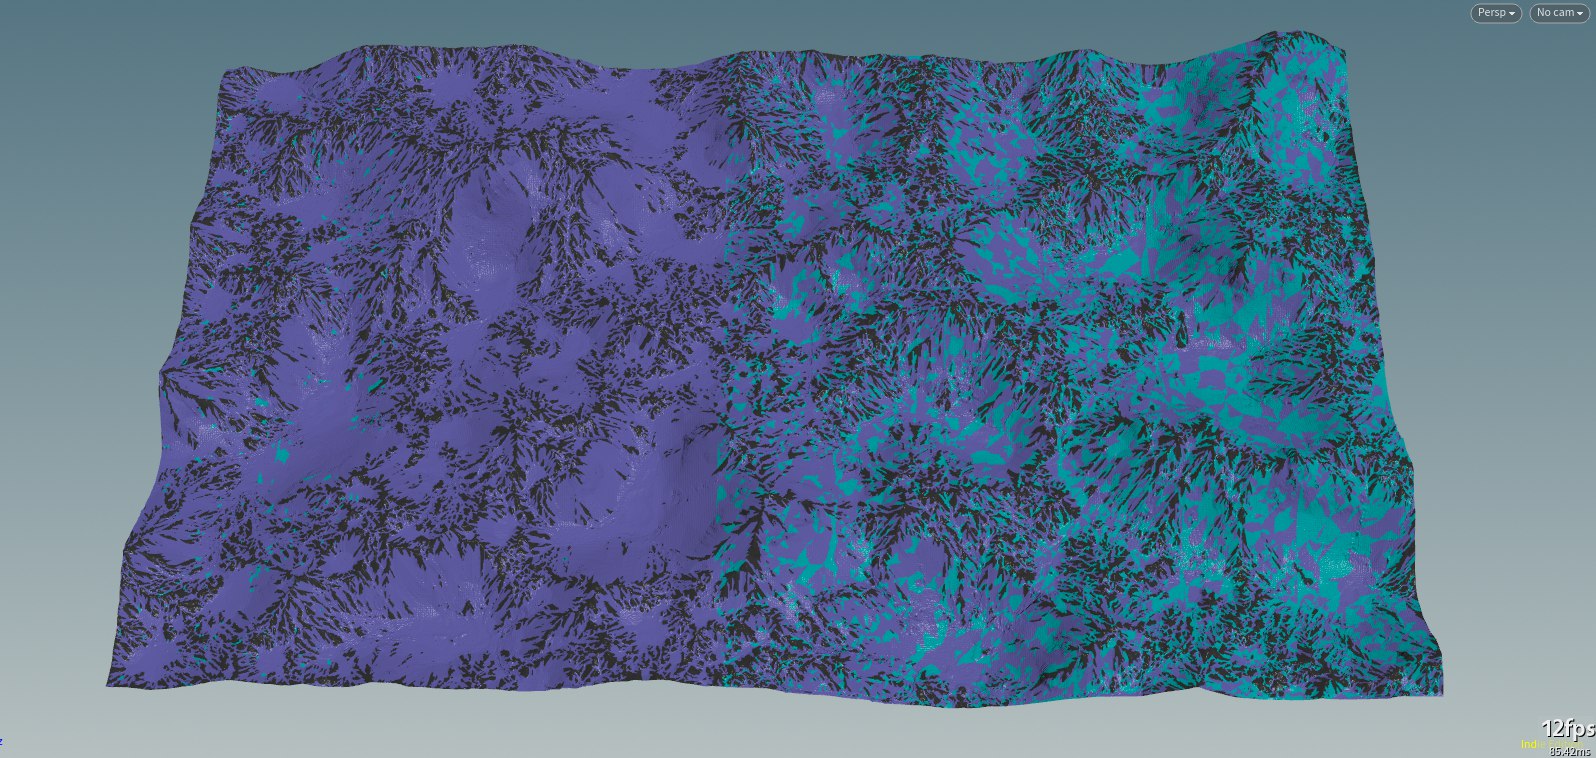
Initial generation of the landscape and clustering of the data
Here I was playing with visualizing (in cyan) the amount of mass lost since 1967:
And here I was thinking of showing the glacier ice as a 'cloth' that would fall out of the landscape:
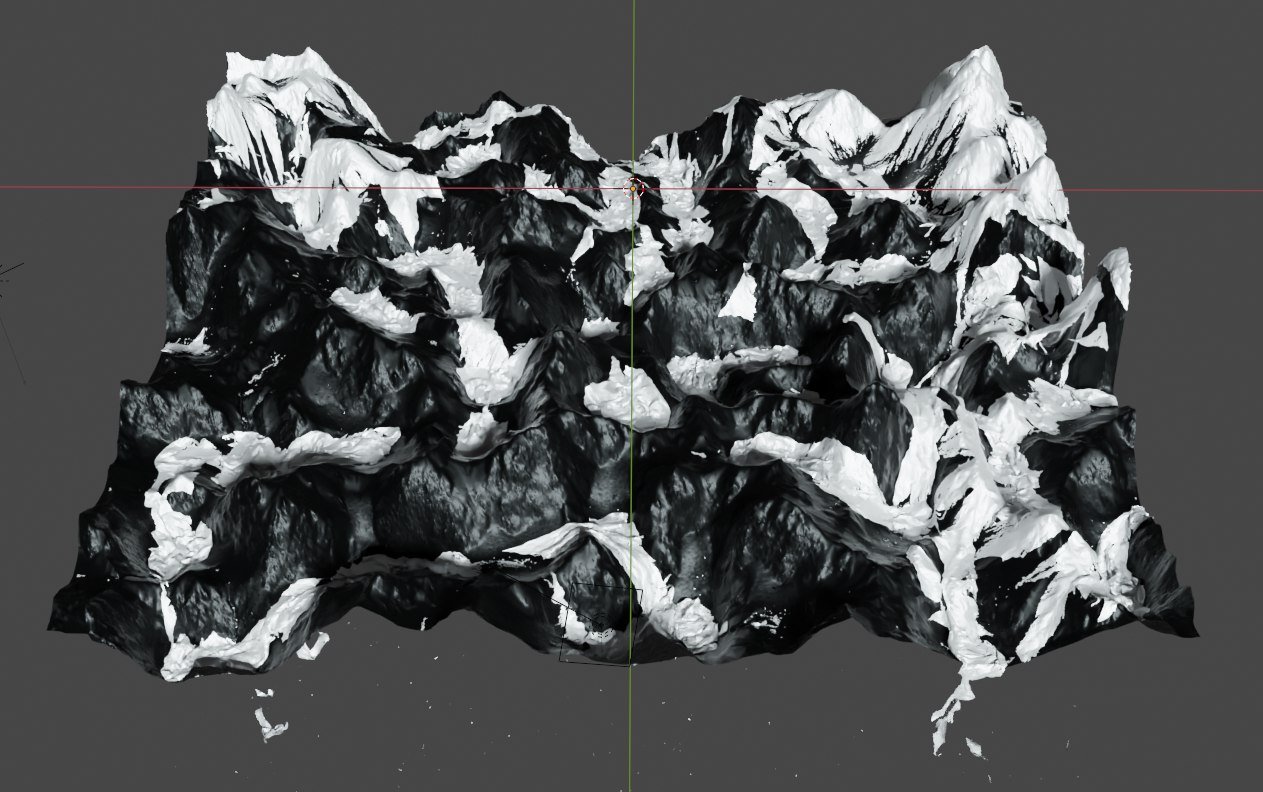
Some of these experiments were really interesting aesthetically, but I was slowly drifting away from the underlying data. Everything was still fully data-driven, but it was easy to over-emphatize certain aspects of the data after plugging them into a physics simulation. Trying to stick as much as possible to the original data while also having to account for a lot of the complexity of translating numbers from different units (the 'real' AREA of the data and the 'virtual' space) was also not an easy task. After a bit of thinking and some necessary pauses, I decided that I didn't need to work in Houdini for this dataset — it didn't need to be 3d at all. I stopped to rethink what the data was telling me, not what I wanted to show through the data.
(re)Thinking
After a pause of a few weeks, I came back to this project with completely new eyes. I started another exploratory phase working with pandas/matplotlib, focusing more on the entirety of the dataset, and not just on the entries related to the Careser. I felt that the story of the Careser was a sad one, and I didn't necessarily wanted to focus only on its 'decadence'. The dataset offered other cues that I could pick up on, and there were plenty of other glaciers whose mass increased (like 'taku'). I also started approaching the data in a more 'rigorous' way: instead of focusing on telling a story at all costs, my goal was to let the visualization truly expose some high level information that people couldn't otherwise easily access. The question become more something like:
What has been going on in the world of glaciers in the past 40 years or so?
I then did most of my work by working solely with code (in Nannou²) - I find it easier to keep a clear link with the data if I'm writing all of the code (parsing, rendering, etc..) myself. The final result is composed of 2 series of images:
- A) A high level view of all of the glaciers in the dataset
- B) A series of drill-downs of every single glacier
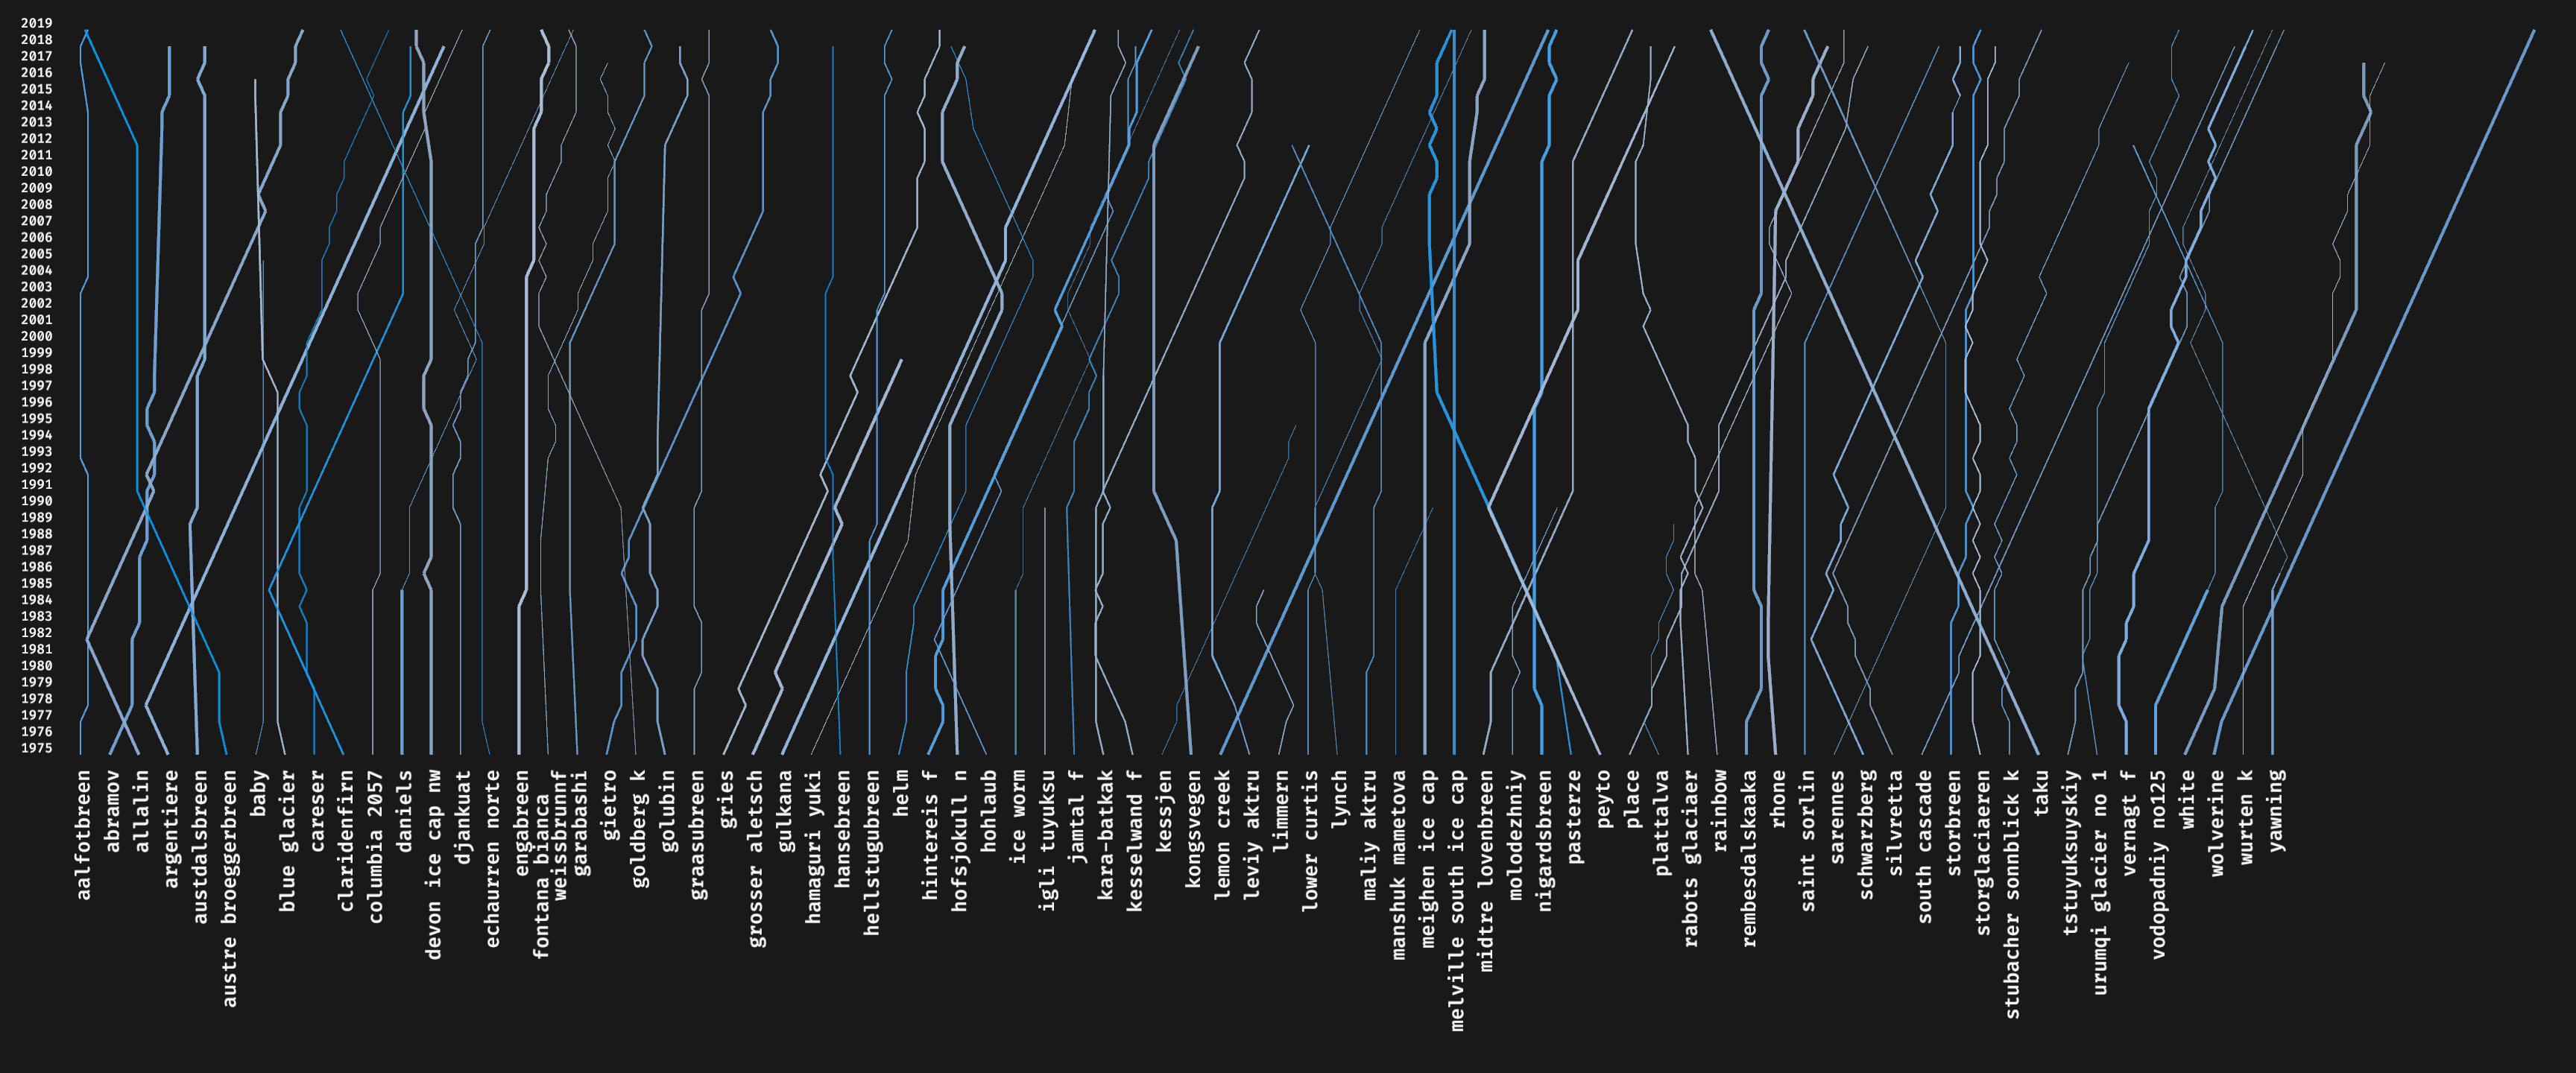
View of all glaciers
A) is the image that opened this article.
For every glacier, it shows the evolution of its mass balance over the years.
If the line goes right, the glacier mass decreased since the last year measured.
If the line goes straight, there has been no recorded change of mass since the last year measured.
If the line goes left the glacier mass increased since the last year measured.
The reason for this peculiar visualization choice is that I didn't want to necessarily be quantitative, so I didn't want to focus the attention on the actual amount of mass. Also, the different scales of the records would have made the visualization hard to read. Instead, I decided to focus only on a more qualitative aspect, one that as humans, we can relate more easily:
has there been growth?
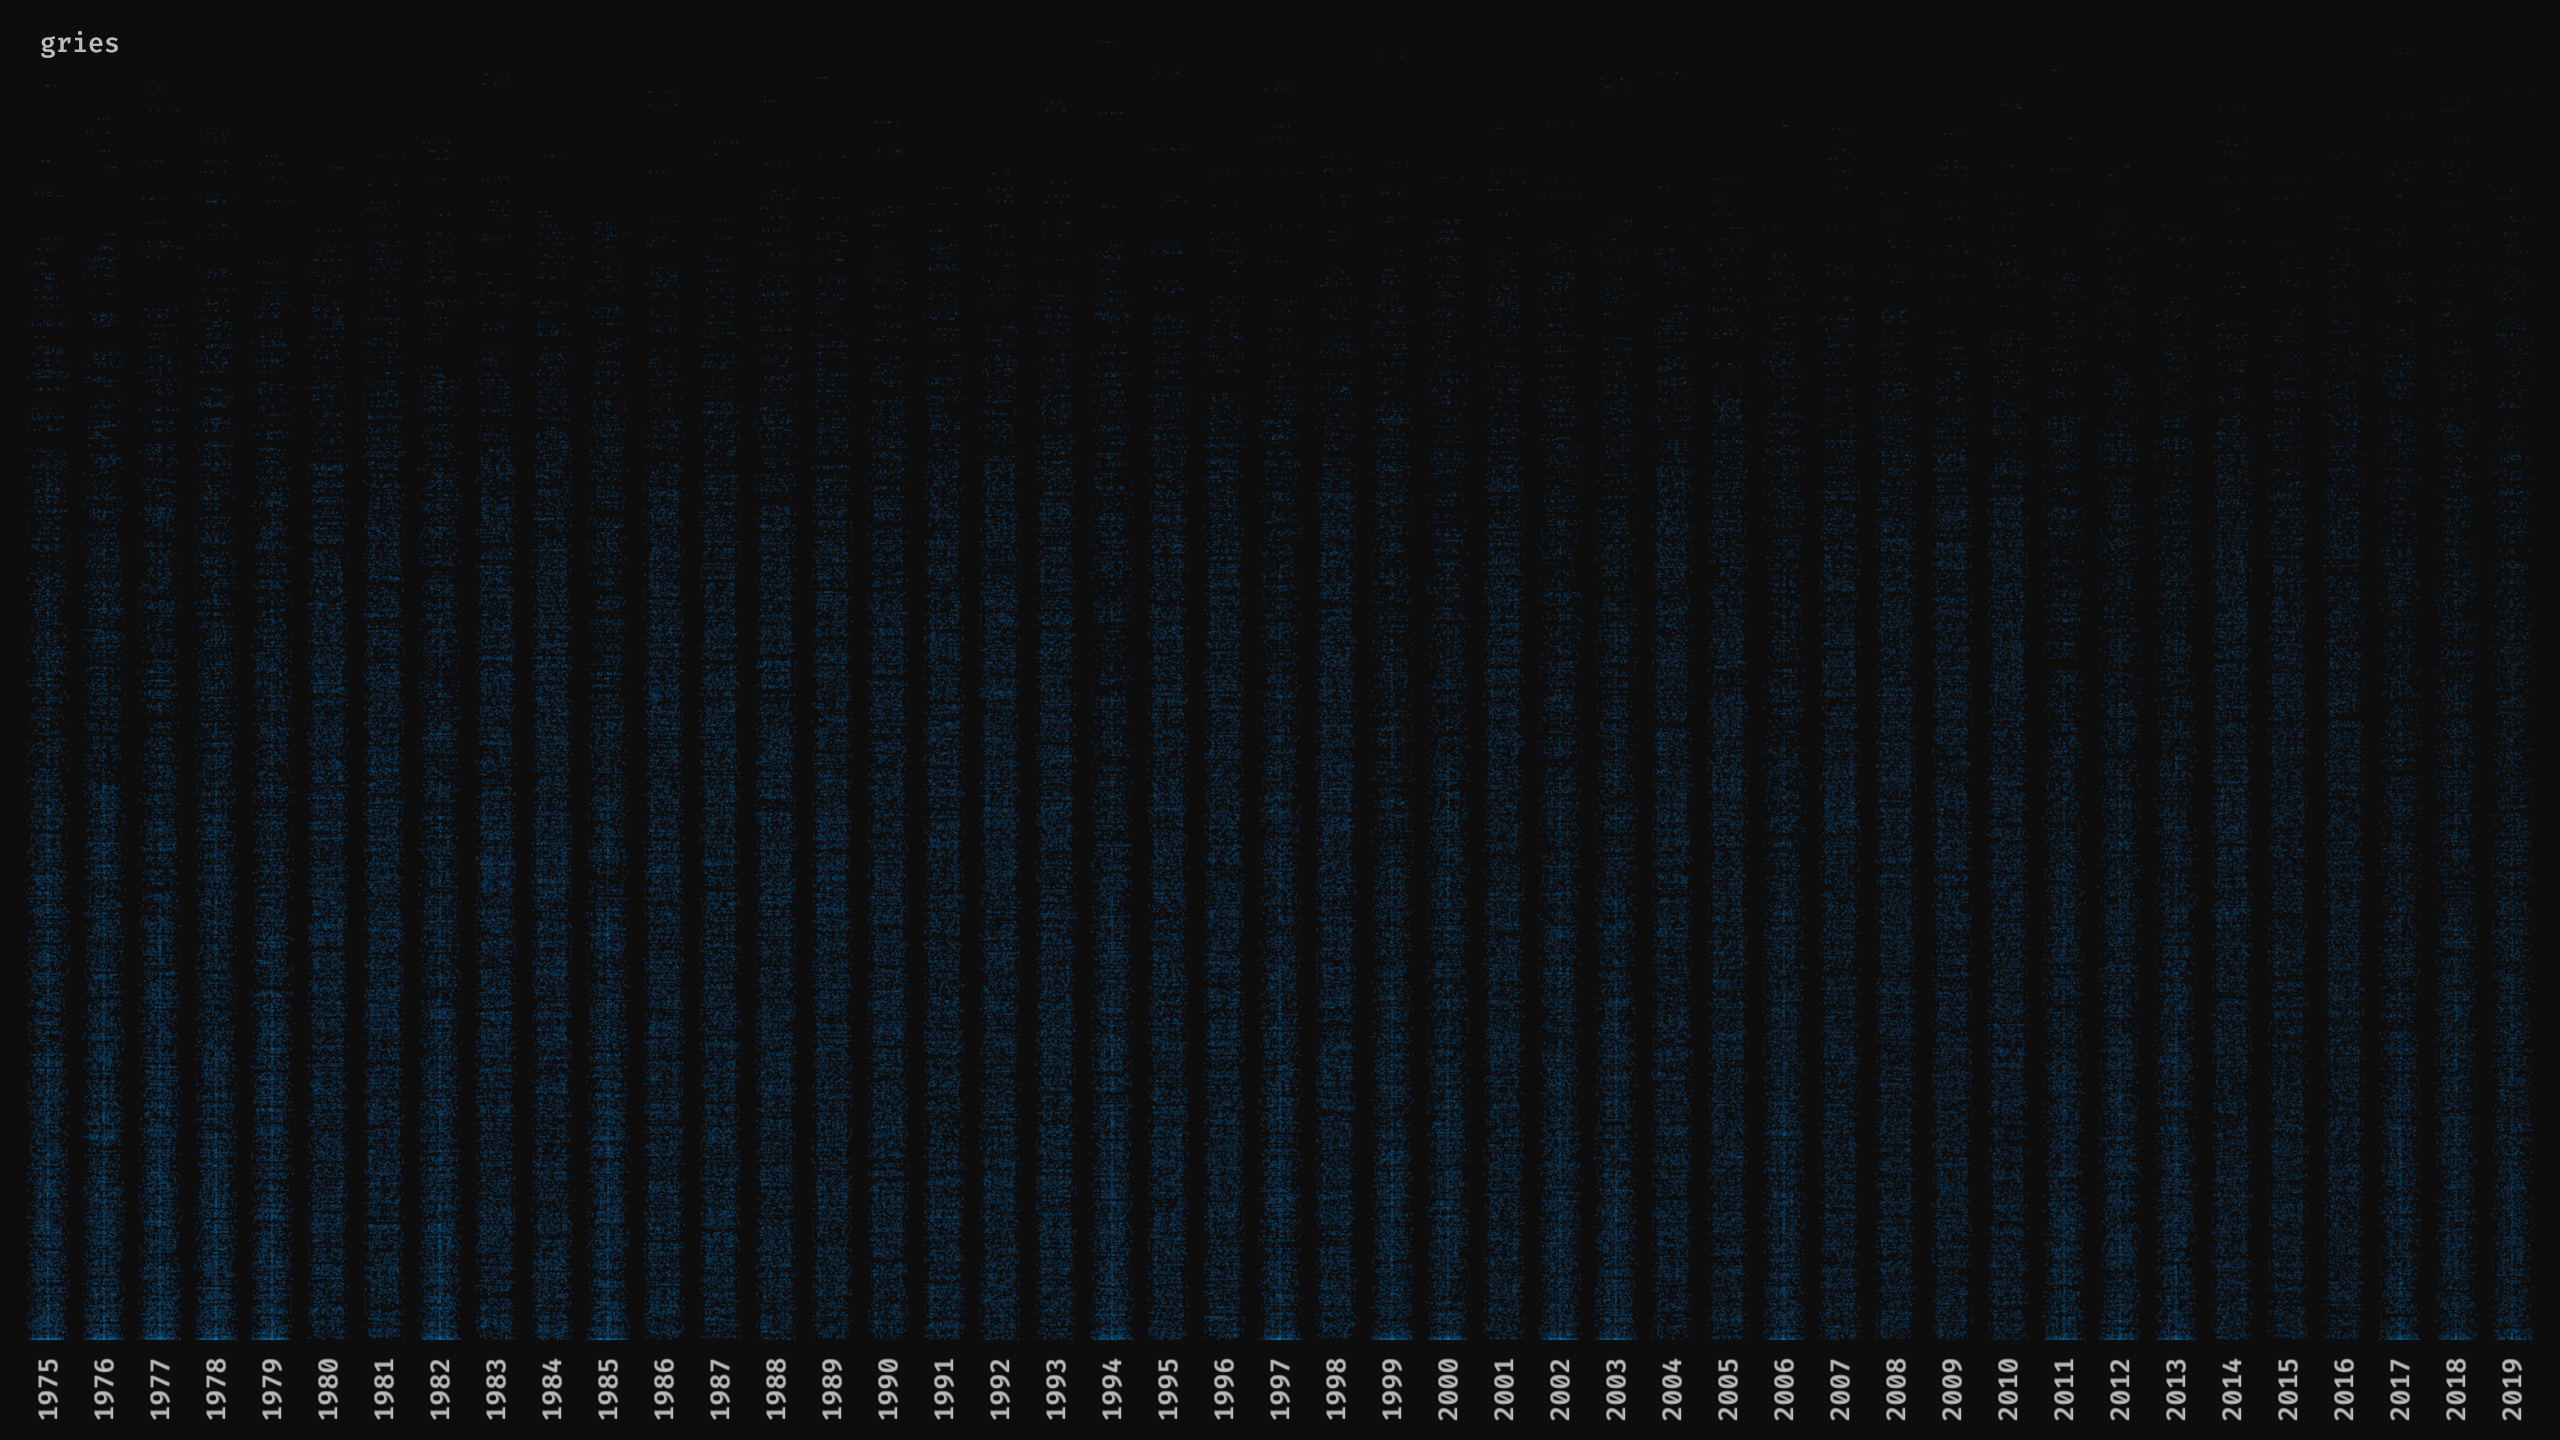
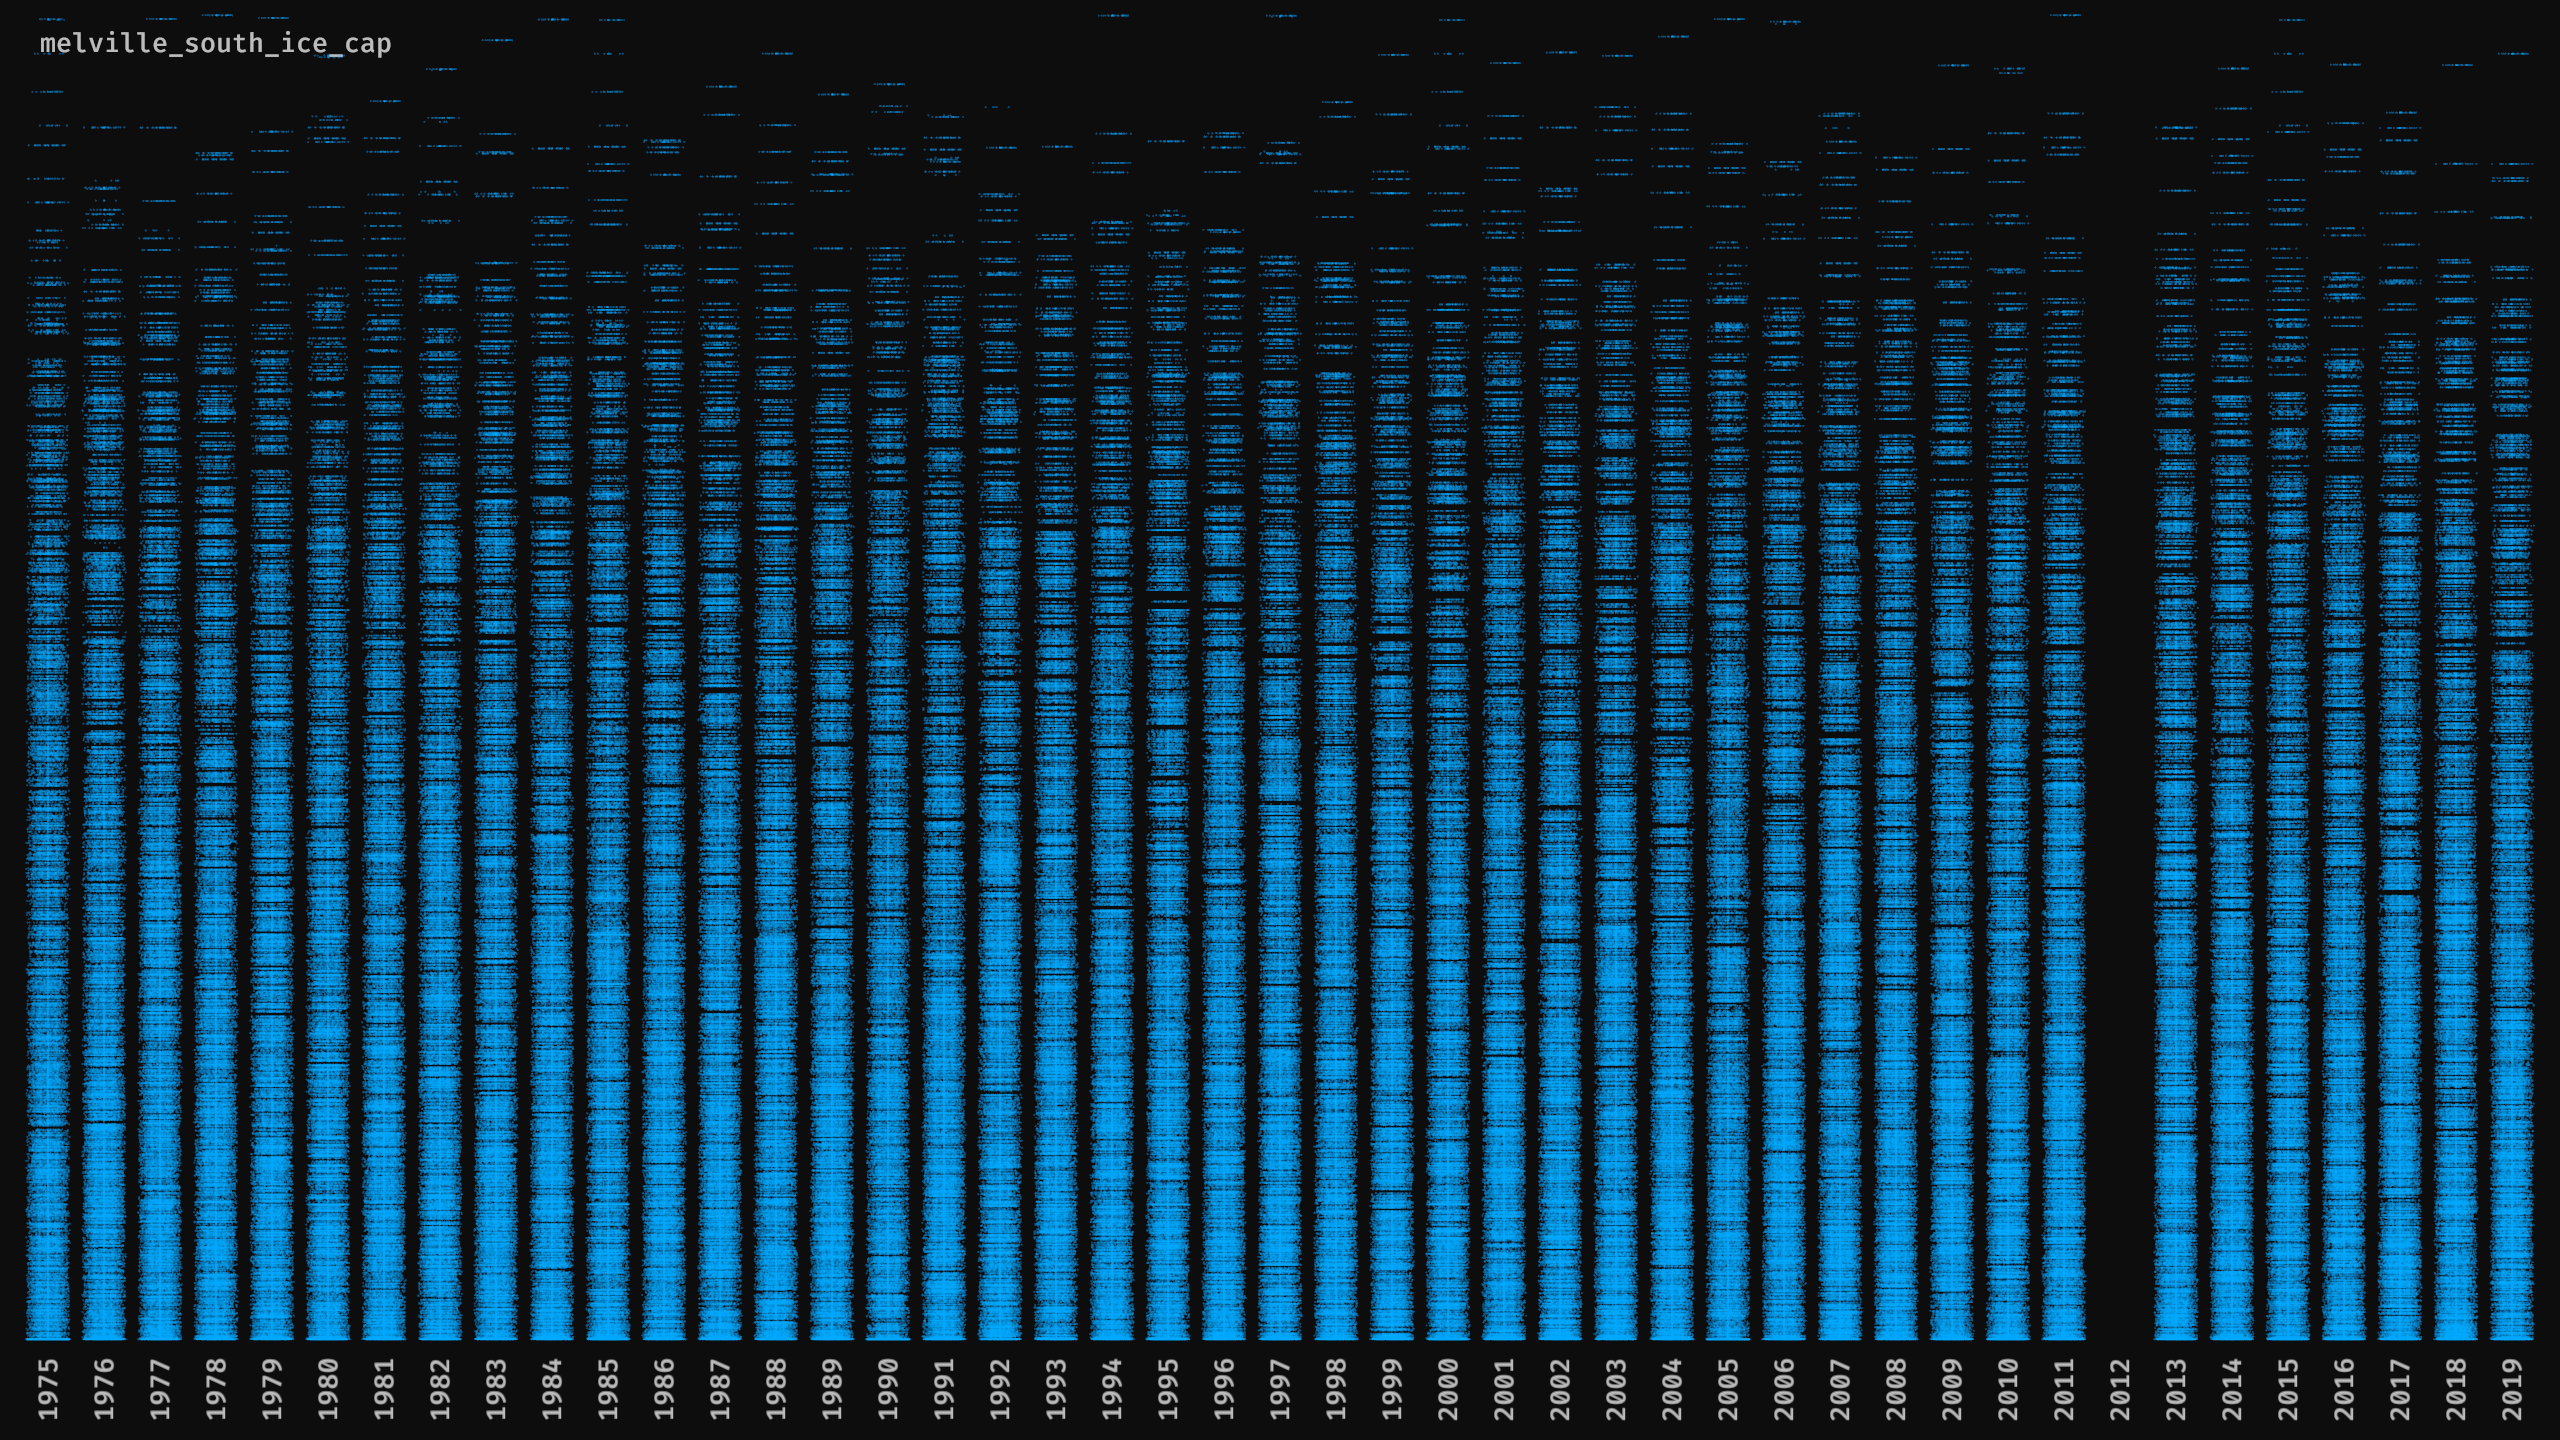
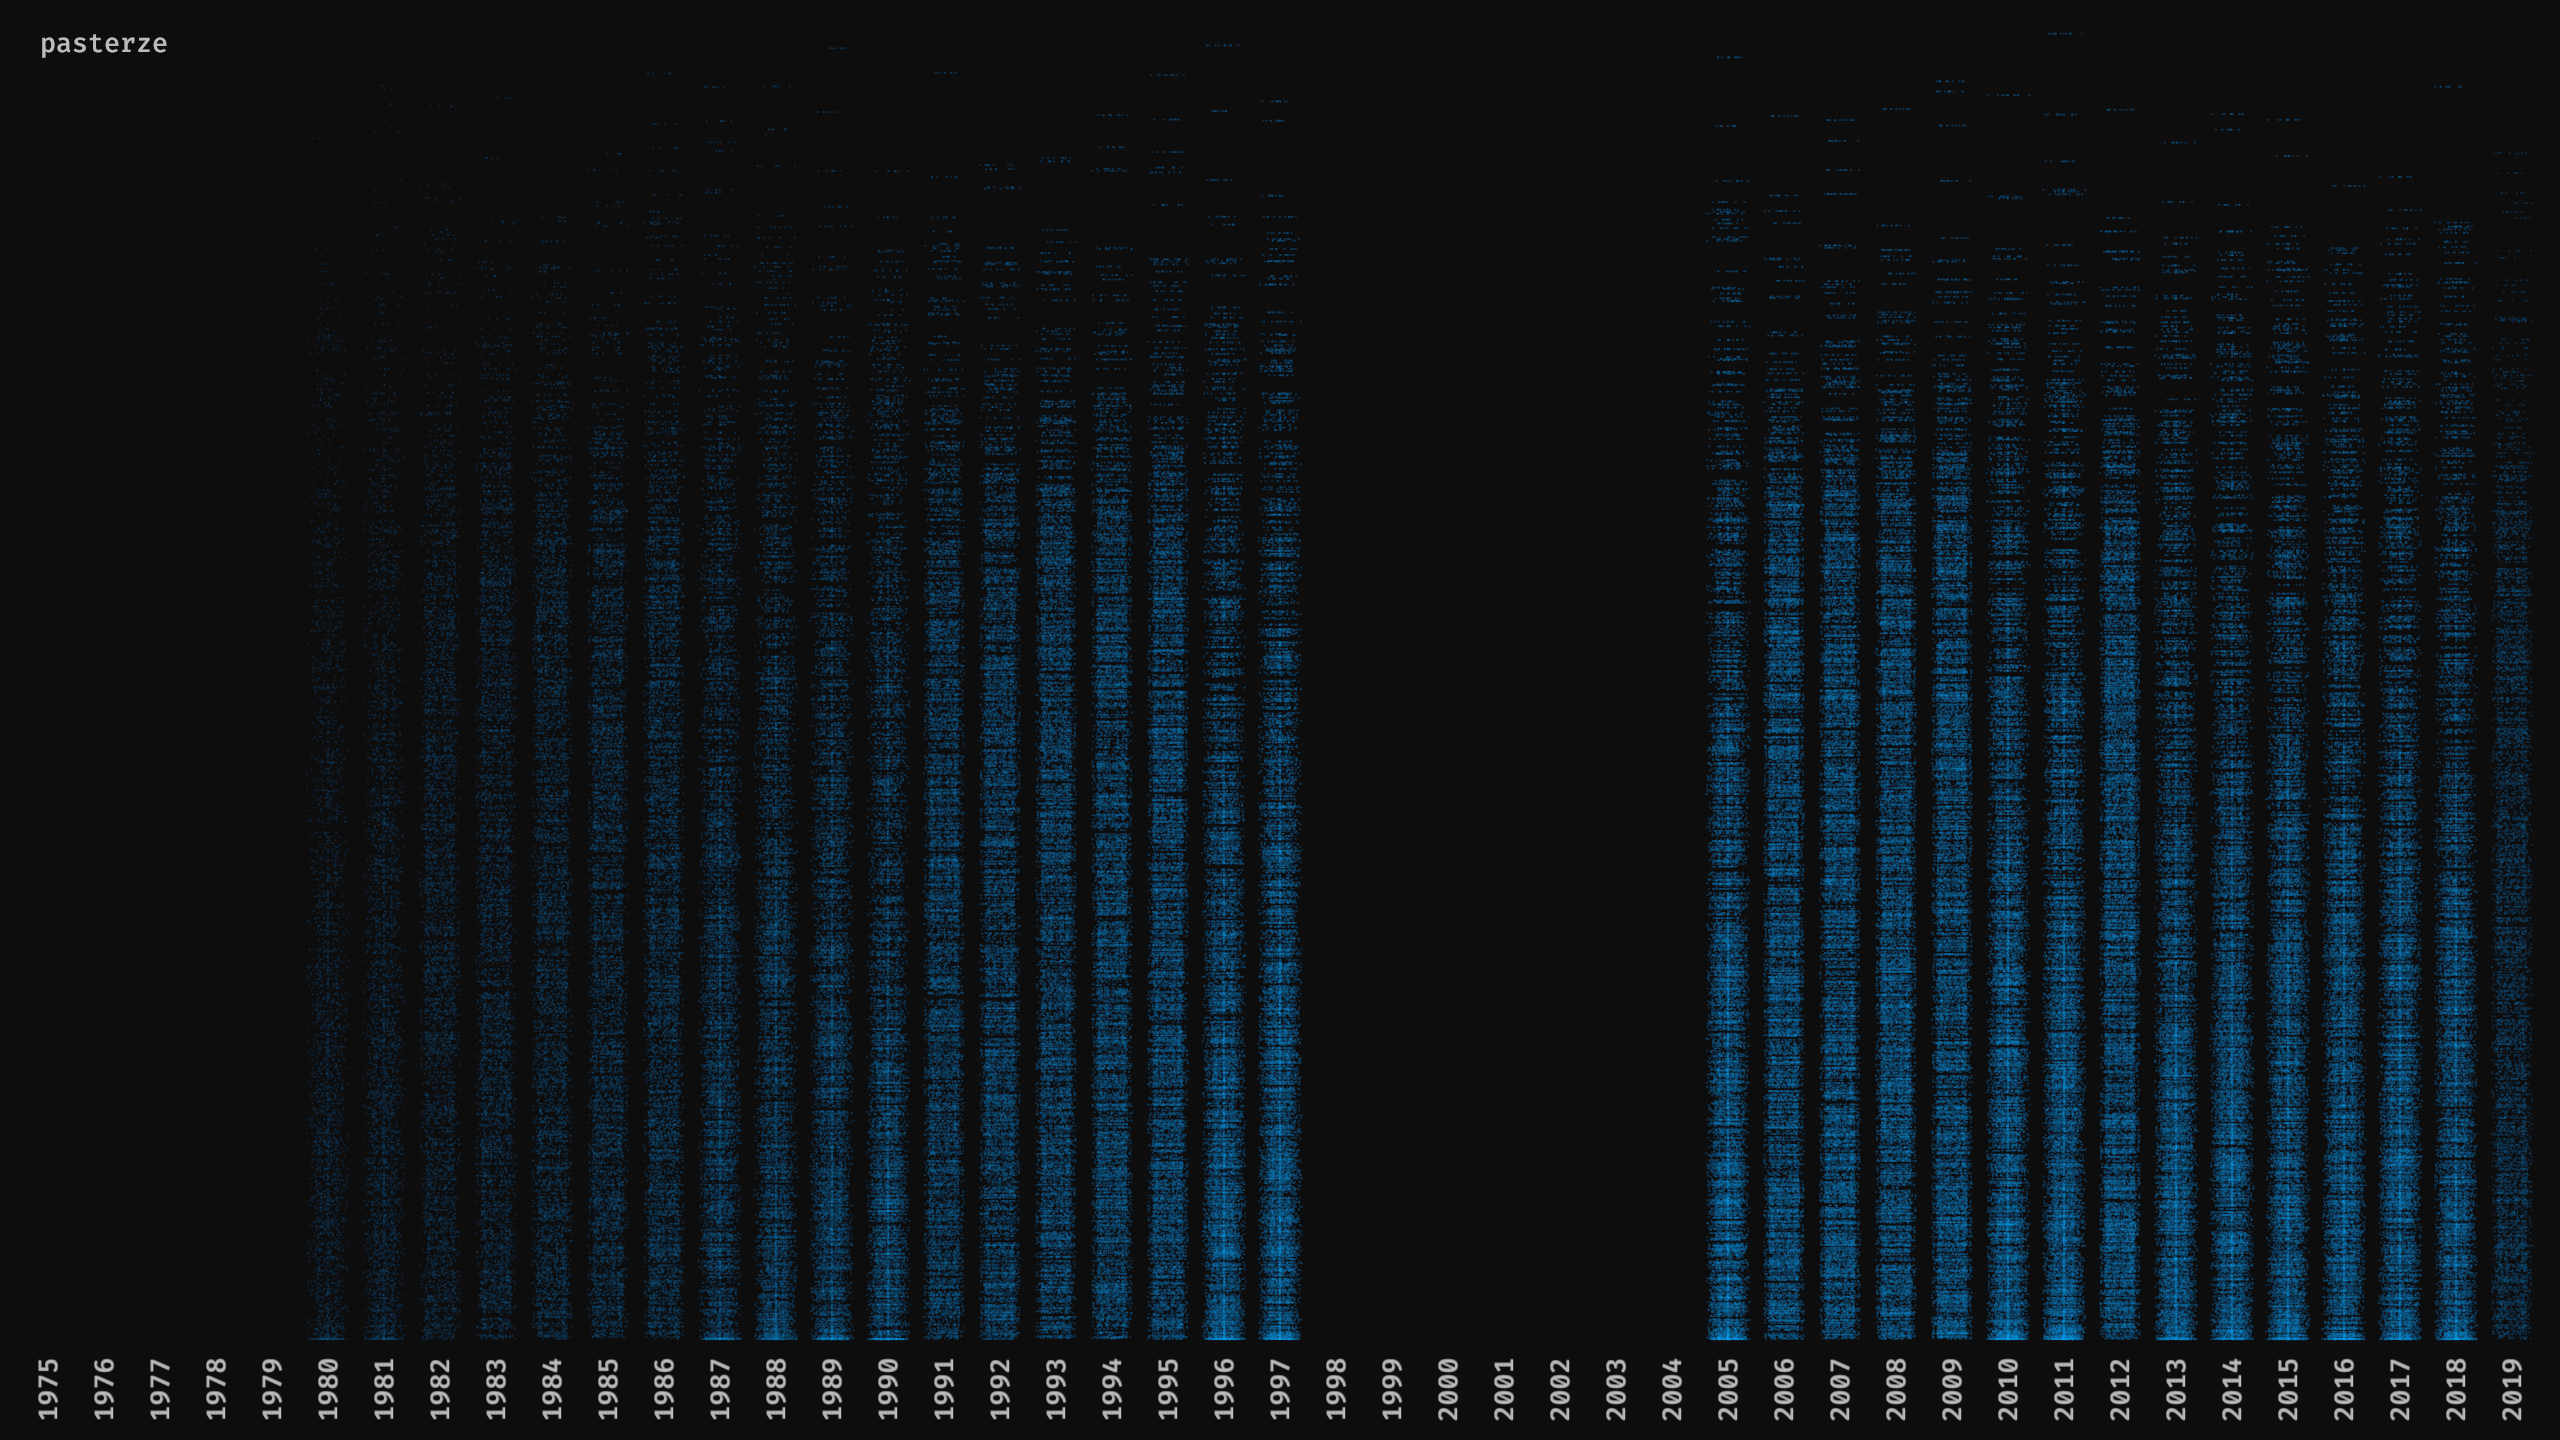
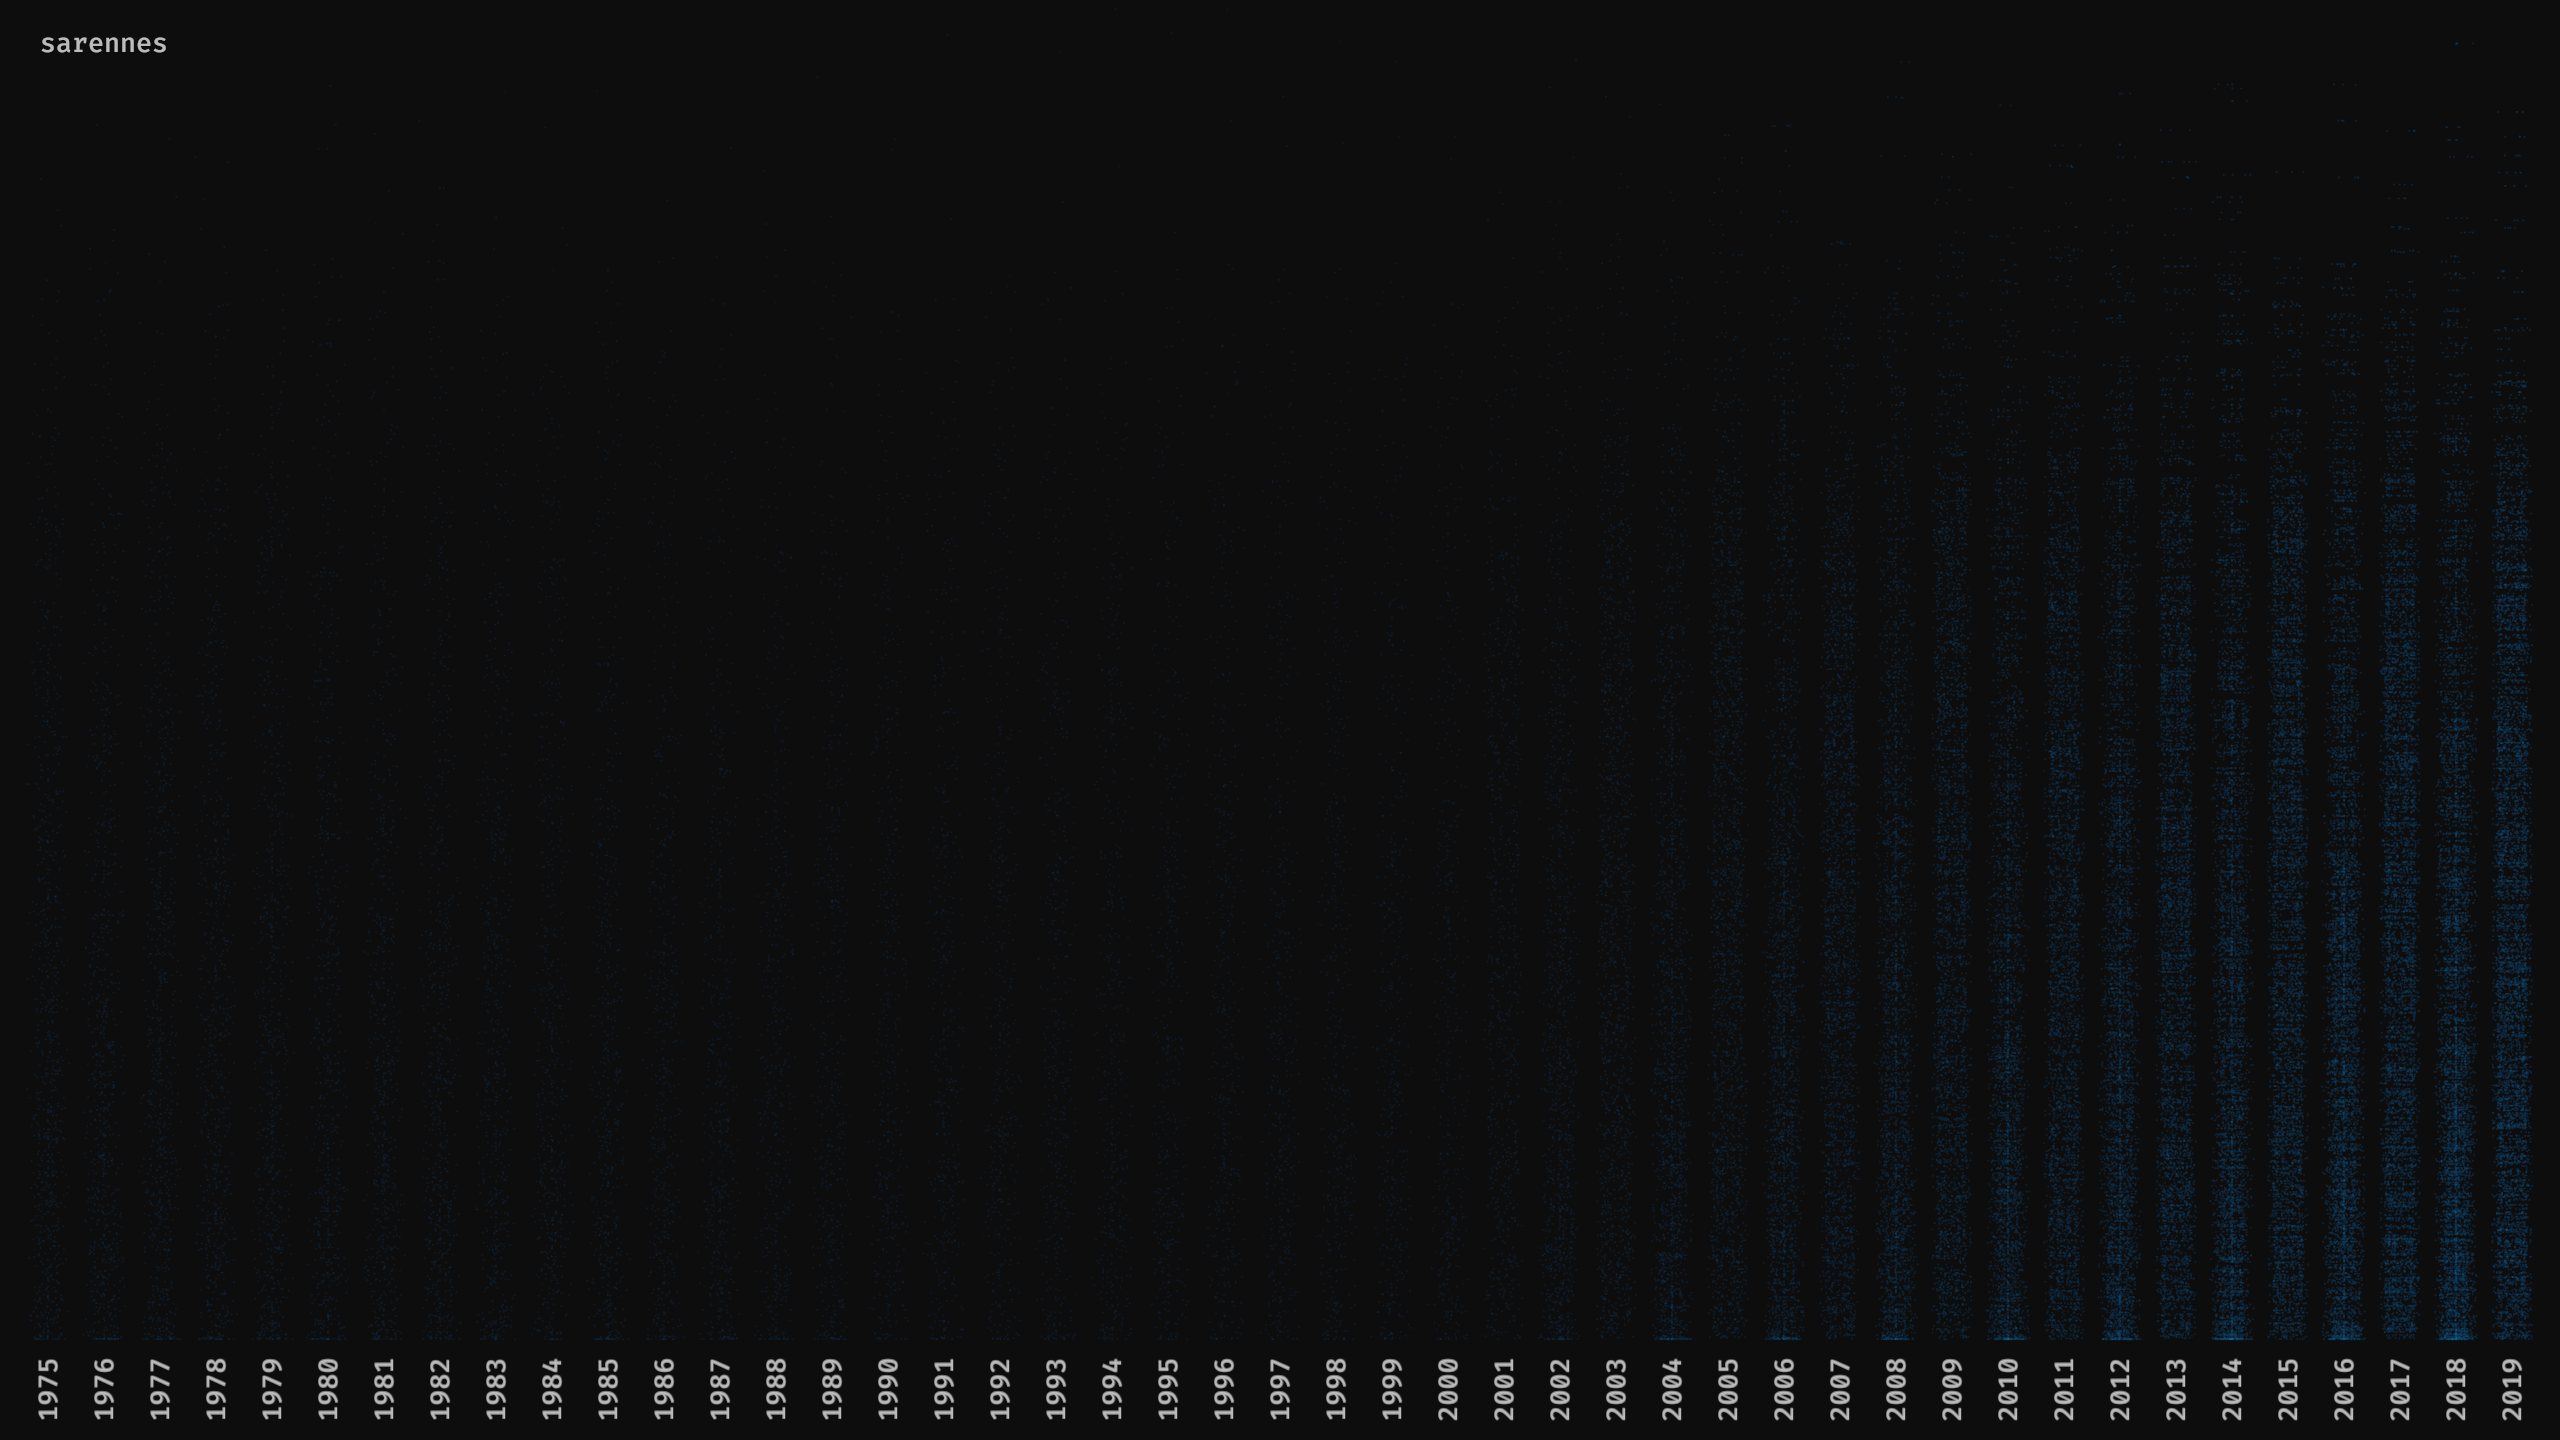
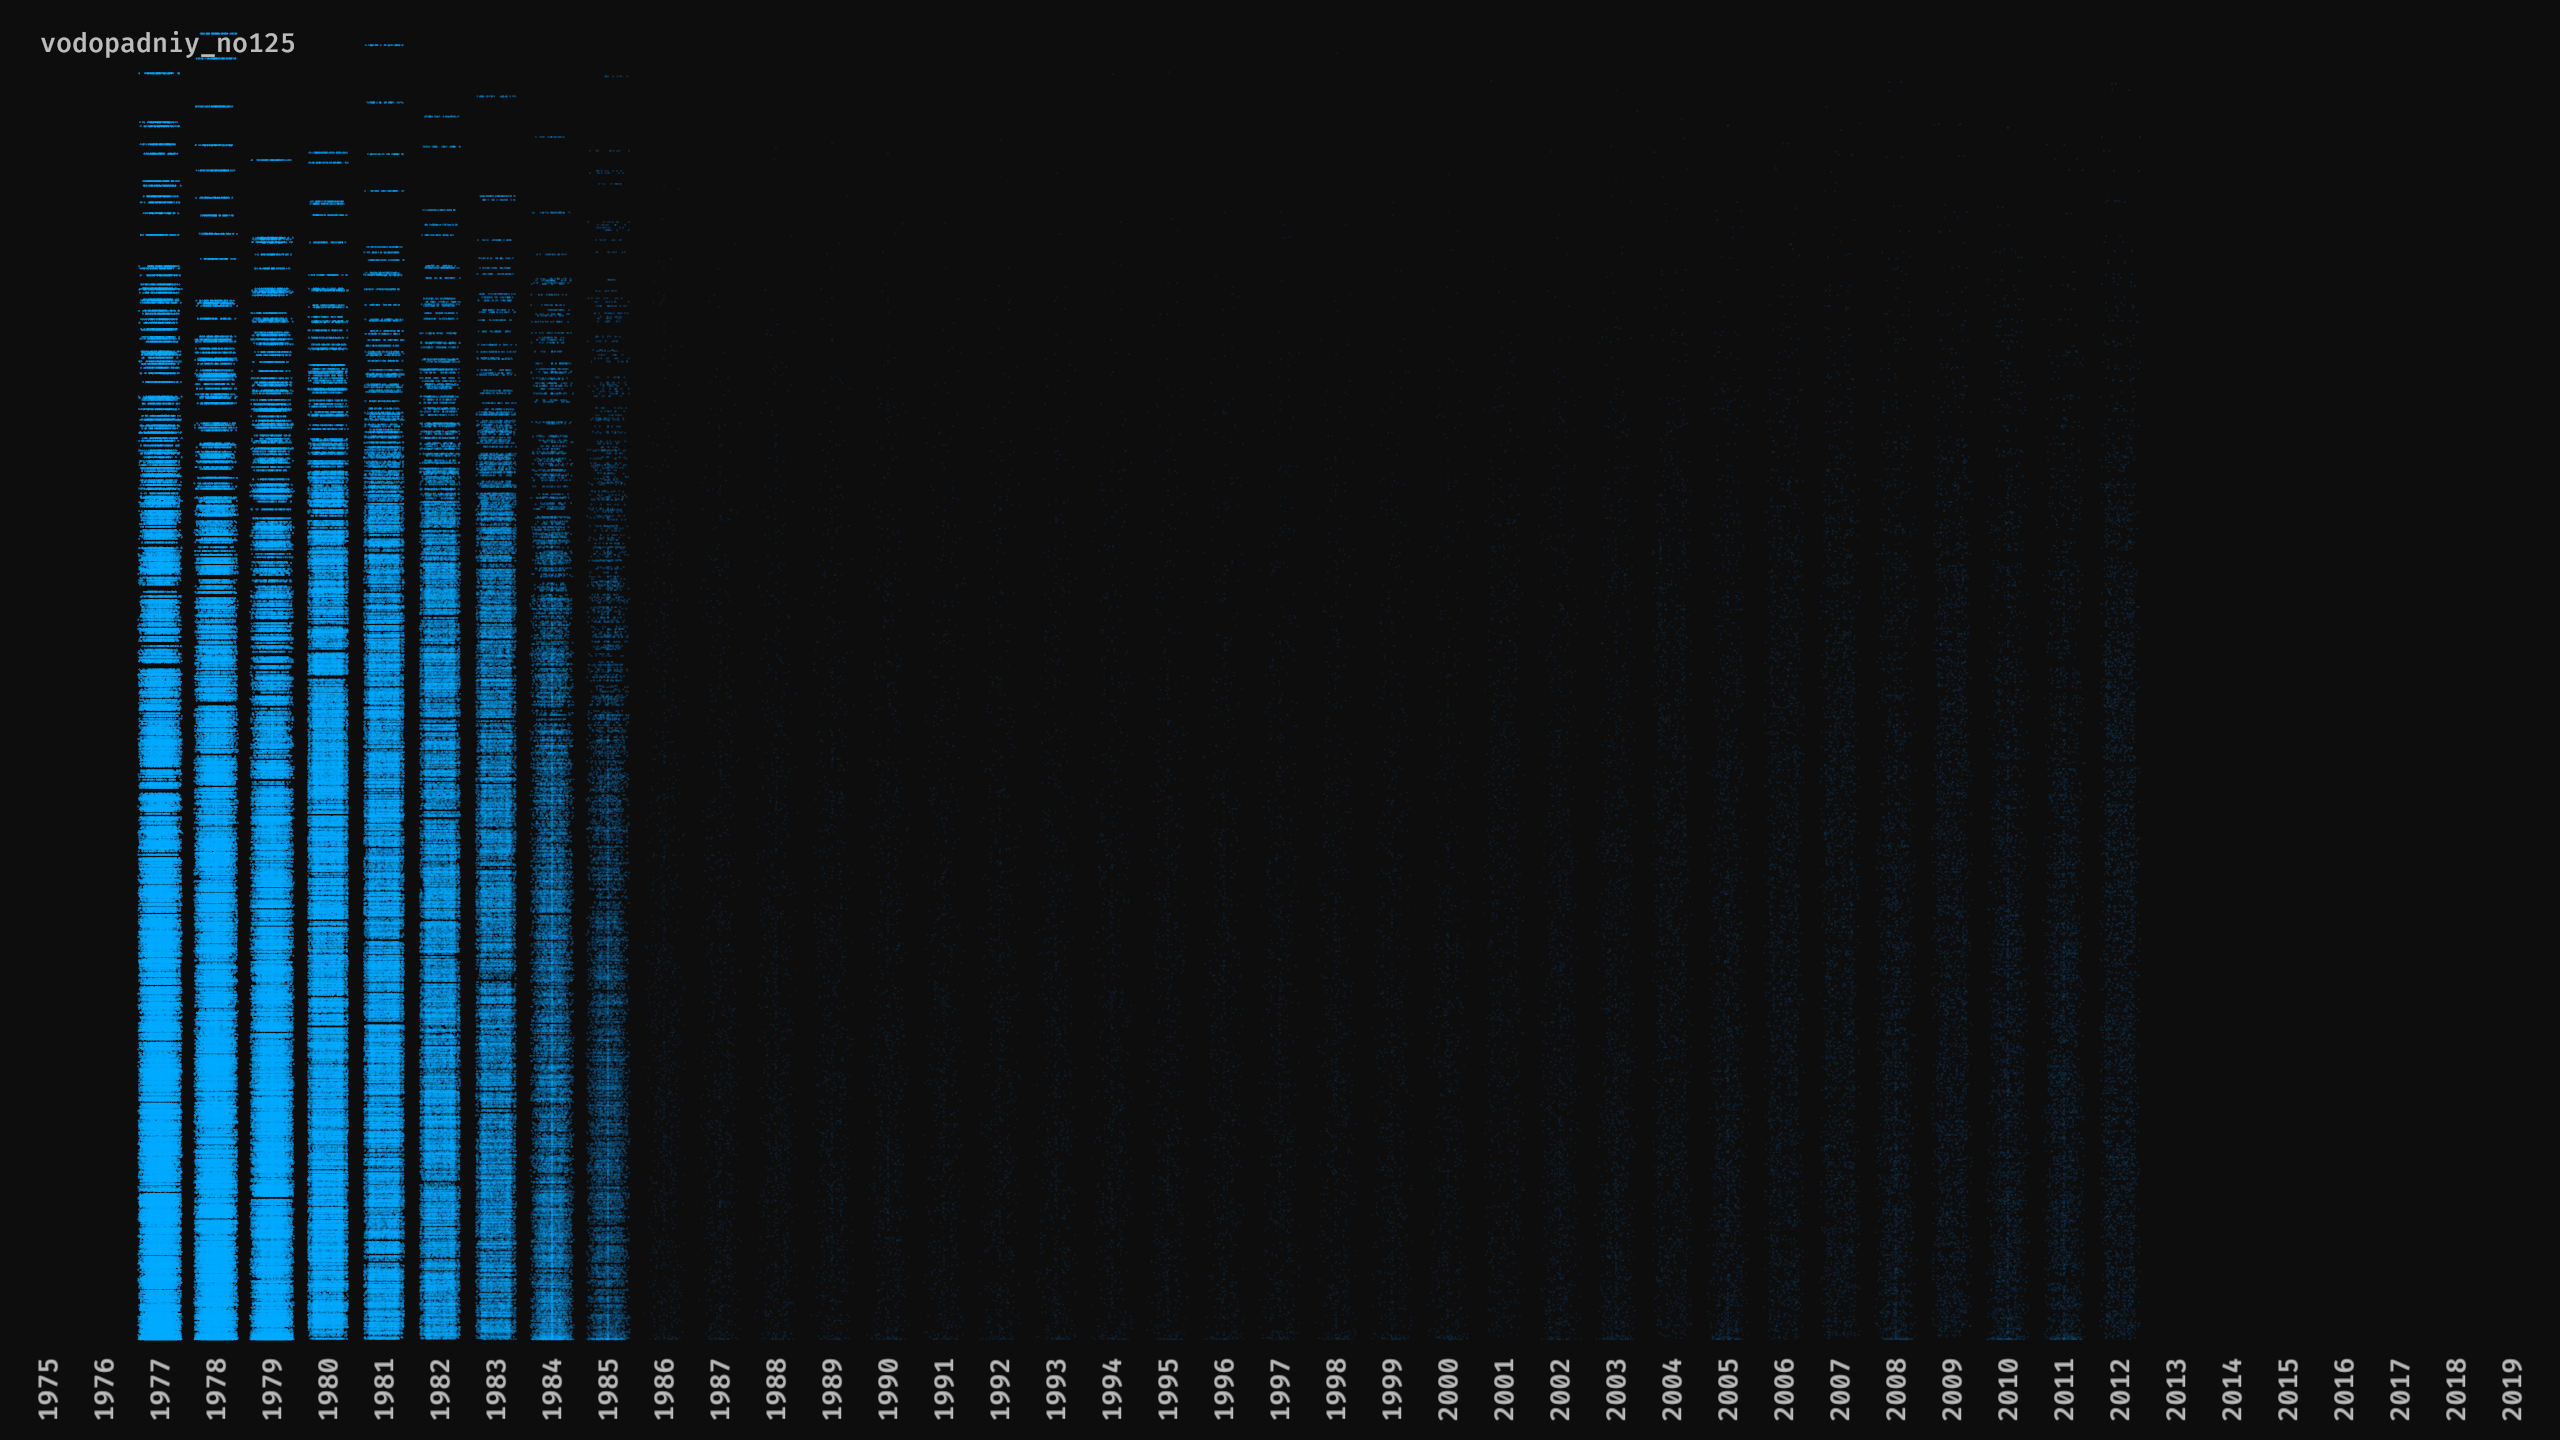
Overview of single glaciers
For the drill downs, I wanted to have something that would make it easier to compare every single glacier to understand more about their life after looking at the high level viz. I decided to render every 1m² of the area of every glacier as one dot on the screen. Their opacity is normalized (=converted to a [0,1] range) based on the biggest and smallest mass present in the dataset. This means that brighter pictures reflect bigger glaciers.
You will notice that years with missing data have no dots: and this is precisely to avoid misinforming in any way (by doing rolling averages, interpolations, et cetera.).
Here's an extract at some of them:
Gries
Melville South Ice Cap
Pasterze
Sarennes
Vodopadniy No125
Footnotes